
In DevOps, managing complex, cloud-native systems requires more than static thresholds. Behavioural anomaly detection steps in by using machine learning to identify unusual patterns in telemetry data - like CPU usage, API response times, or network traffic. This approach helps detect issues early, preventing outages and security threats.
Key Insights:
- What it does: Detects anomalies (point, contextual, collective) by learning what
normal
system behaviour looks like. - Why it matters: Reduces Mean Time to Detect (MTTD) and Mean Time to Resolution (MTTR), improving system reliability and security.
- How it works: Uses algorithms like Isolation Forest, One-Class SVM, and LSTM-based autoencoders to process logs, metrics, and traces.
- Use cases:
- Infrastructure monitoring: Identifies unusual spikes in CPU, memory, or network activity.
- Application performance: Tracks latency, error rates, and resource bottlenecks.
- Security detection: Highlights suspicious behaviour, insider threats, and zero-day attacks.
This technique shifts teams from reactive to preventive problem-solving, making it ideal for microservices and Kubernetes environments. By integrating tools like Prometheus, Grafana, or Datadog, DevOps teams can streamline anomaly detection into their workflows, improving both performance and security.
DevOps Real-Time Anomaly Detection with Machine Learning | Fawaz Ghali | IDI 2024
Techniques and Principles Behind Anomaly Detection
::: @figure 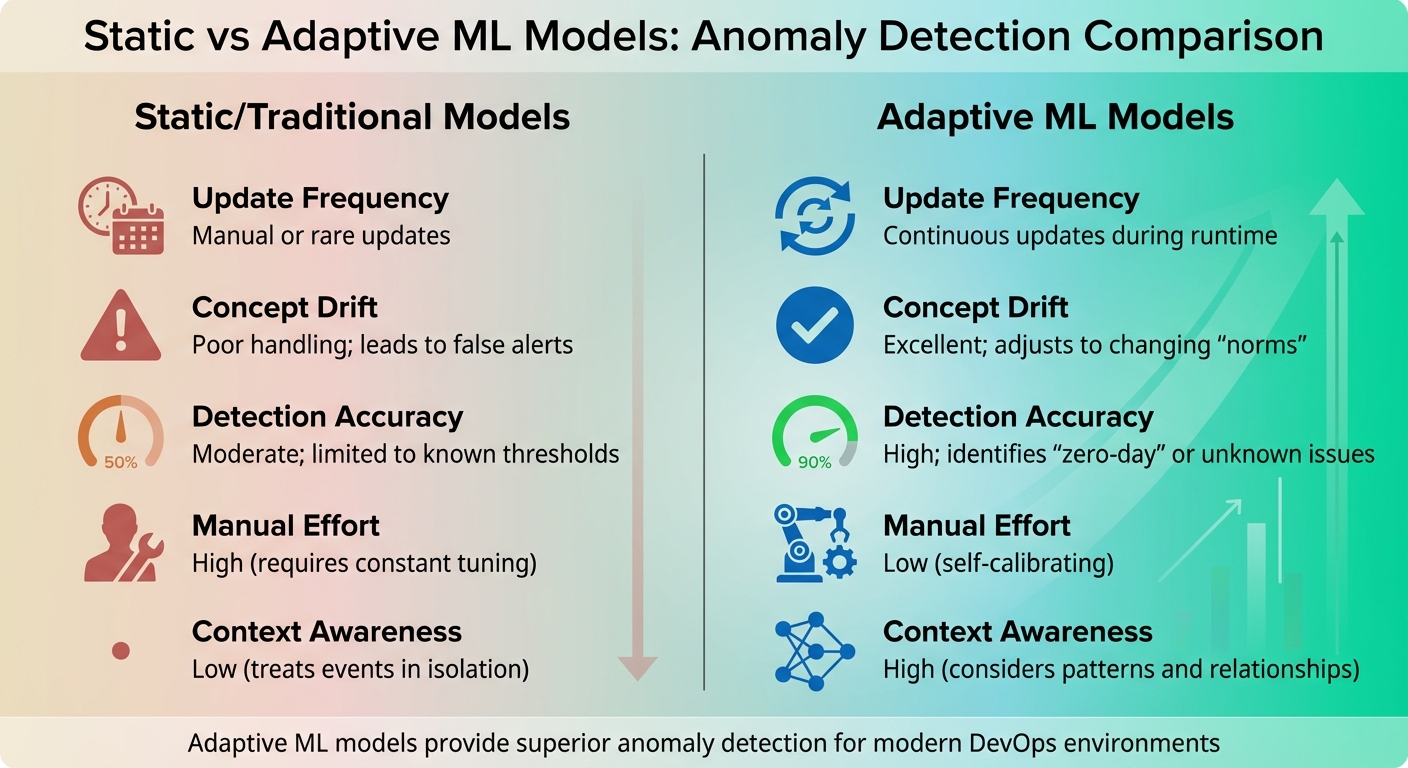 {Static vs Adaptive ML Models for Anomaly Detection in DevOps}
:::
{Static vs Adaptive ML Models for Anomaly Detection in DevOps}
:::
Behavioural anomaly detection uses machine learning algorithms to establish what normal
behaviour looks like and flag any deviations. These methods analyse telemetry data - like logs, metrics, and traces - to uncover patterns that might escape human observation. The choice of algorithm often depends on whether the focus is on identifying known threats or discovering entirely new failure modes.
Machine Learning Algorithms for Anomaly Detection
Isolation Forest operates on the idea that anomalies are rare and distinct, making them easier to isolate from normal data points. By randomly partitioning the dataset, the algorithm can identify outliers with fewer splits. Since it’s an unsupervised method, it doesn’t require labelled data, making it particularly effective in cloud-native environments where new failure modes frequently emerge [7].
One-Class SVM works by creating a boundary around normal behaviour. It’s trained exclusively on data that represents normal
conditions, flagging anything outside this boundary as an anomaly. This semi-supervised technique is useful when there’s a wealth of clean historical data on healthy system states but limited examples of failures.
For time-series data, such as API response times or CPU usage, autoencoders are often employed. These models compress input data into a lower-dimensional representation and then reconstruct it. A high reconstruction error signals a deviation from the learned baseline. Autoencoders based on LSTM models are particularly effective at capturing time-related patterns in DevOps telemetry [7].
ADWIN (Adaptive Windowing) tackles the issue of concept drift. As systems evolve - whether through new deployments or seasonal traffic changes - the definition of normal
shifts. ADWIN monitors data distributions in real time and triggers automatic model retraining when significant changes occur, ensuring detection accuracy remains high [7].
Today’s teams increasingly prefer adaptive models over static thresholds. In enterprise IT systems, anomalies often stem from network intrusions, configuration issues, or performance failures. To enhance detection accuracy across multiple infrastructure layers, many organisations combine algorithms - using Random Forest for identifying known threats and Isolation Forest for spotting unknown issues [7].
Next, let’s explore the data sources and feature engineering techniques that make these algorithms work effectively.
Data Sources and Feature Engineering
Anomaly detection’s success hinges not just on advanced algorithms but also on gathering the right data and engineering meaningful features. DevOps teams typically rely on three key data sources:
- Logs: Unstructured text from systems and applications, including event messages and severity levels.
- Metrics: Time-series data such as CPU usage, memory consumption, and network throughput.
- Traces: Application-level telemetry like API response times and service call latency.
Tools like Fluentd or Logstash collect and forward this data to central systems, while platforms like Kafka or Pub/Sub handle real-time ingestion for high-velocity environments.
Pre-processing transforms raw telemetry into features that machine learning models can interpret. For example, logs are vectorised using techniques like TF-IDF to convert text into numerical data. Numerical metrics are normalised to prevent biases caused by differing units, such as CPU percentages versus memory bytes. Temporal aggregation, such as grouping data into 30-second intervals, helps capture trends in latency and error rates.
Context is a critical factor in feature engineering. A 300% traffic spike during a product launch might be expected, but the same spike on a quiet Tuesday morning could indicate a problem. Features that account for temporal baselines - daily or weekly patterns - help distinguish normal seasonal changes from genuine anomalies. Additionally, focusing on golden signals
like error rates, as opposed to volume-based metrics, reduces false positives by prioritising indicators that directly reflect system health.
| Criteria | Static/Traditional Models | Adaptive ML Models |
|---|---|---|
| Update Frequency | Manual or rare updates | Continuous updates during runtime |
| Concept Drift | Poor handling; leads to false alerts | Excellent; adjusts to changing norms |
| Detection Accuracy | Moderate; limited to known thresholds | High; identifies zero-dayor unknown issues |
| Manual Effort | High (requires constant tuning) | Low (self-calibrating) |
| Context Awareness | Low (treats events in isolation) | High (considers patterns and relationships) |
Use Cases of Behavioural Anomaly Detection in DevOps
Behavioural anomaly detection shifts DevOps teams from reacting to issues after they occur to preventing them before they happen. Instead of relying on static thresholds, these systems identify early warning signs, cutting down Mean Time to Detect (MTTD) and stopping minor problems from snowballing into major outages. This is especially important in cloud-native setups with microservices and Kubernetes, where fleeting pods and intricate service meshes create unpredictable challenges that traditional rules struggle to manage.
Infrastructure Monitoring
Detecting anomalies in infrastructure helps identify problems like unusual CPU spikes, unexpected network traffic, or storage failures before they disrupt operations. In a microservices environment, advanced AI tools can correlate seemingly minor events - like a slight memory increase and a small drop in response time - to uncover issues like memory leaks that single-metric monitors might miss.
Using context-aware baselines, tools can define normal
behaviour by analysing metadata from container images, PodSpecs (privileges, capabilities), and NetworkPolicies. Containers, with their relatively predictable patterns, are easier to baseline compared to virtual machines, which involve more complex activity due to their broader operating systems.
Beyond performance, anomaly detection also helps spot irregular cloud spending caused by misconfigurations or inefficient resource use. For example, real-time data pipelines can process 150 GB of data in just 10 minutes for feature extraction. Tools like BigQuery ML can train clustering models on terabyte-scale datasets in under 15 minutes [5].
This level of monitoring sets the stage for tackling application-specific challenges.
Application Performance Monitoring
In application performance monitoring (APM), anomaly detection identifies issues like slow response times, high error rates, and resource bottlenecks during continuous deployment cycles. Machine learning models analyse historical data - such as latency, throughput, and error rates - to create automated baselines. For instance, Cisco Cloud Observability typically requires 48 hours of data collection to train a model for a monitored entity [6].
By normalising metrics, these systems reduce unnecessary alerts. Instead of flagging raw error counts, they calculate an Error Rate (errors per minute divided by calls per minute) to distinguish between real performance issues and traffic-induced spikes. Predictive models like LSTM and Prophet forecast future resource needs, allowing teams to scale resources proactively, avoiding user impact.
| APM Entity Type | Monitored Metrics for Anomalies |
|---|---|
| Business Transactions | Average Response Time (ART), Calls per Minute (CPM), Errors per Minute (EPM) |
| Services | Average Response Time (ART), Calls per Minute (CPM), Errors per Minute (EPM) |
| Service Endpoints | Average Response Time (ART), Calls per Minute (CPM), Errors per Minute (EPM) |
| Service Instances | Average Response Time (ART), Calls per Minute (CPM), Errors per Minute (EPM) |
Contextual awareness ensures that natural traffic surges, like Black Friday sales, don’t trigger false alarms. Advanced algorithms account for daily and weekly trends, and ideally, they’re trained on at least a year’s worth of data to capture seasonal and annual patterns [3][10]. Additionally, AI-driven systems speed up root cause analysis by ranking potential causes and providing detailed call paths from the anomaly’s source to the affected entity. This significantly reduces Mean Time to Resolution (MTTR) [1][6].
Security Threat Detection in DevSecOps
In DevSecOps, behavioural analysis highlights suspicious user behaviour, unauthorised access attempts, and runtime threats within DevOps pipelines. User and Entity Behaviour Analytics (UEBA) can detect impossible travel
scenarios - where logins occur from geographically distant locations in a short time frame - as well as other unusual interactions and privileged account misuse [2].
Traditional signature-based tools often fail to catch zero-day attacks or insider threats that don’t match known malicious patterns [2]. Behavioural models, on the other hand, can identify lateral movements, data exfiltration attempts (like unusual bulk transfers from Amazon S3), and critical resource deletions (e.g., disks, key vaults, storage accounts) [8].
In Kubernetes environments, anomaly detection can flag activities like running unauthorised binaries, payload drops on read-only filesystems, or violations of network segmentation policies [4]. For example, if a Kubernetes PodSpec enforces a read-only filesystem, any attempt to drop a payload is immediately flagged as a high-confidence anomaly.
Pipeline and supply chain security tools are now leveraging large language models to identify malicious pull requests and monitor for unusual code execution, such as unauthorised PowerShell scripts or virtual machine RunCommand
actions [8][9].
These insights help organisations strengthen their DevOps security and performance. For instance, Hokstad Consulting (https://hokstadconsulting.com) assists businesses in integrating advanced behavioural anomaly detection into their workflows, boosting operational efficiency and security.
Next, we’ll dive into how these detection techniques can be seamlessly integrated into DevOps workflows.
How to Integrate Anomaly Detection into DevOps Workflows
Implementation Steps
Begin by consolidating your logs into a single, searchable repository. This simplifies access and analysis. The next step is data ingestion - gather metrics, logs, and traces from across your infrastructure. If you're dealing with high data volumes, consider using intelligent sampling. This approach helps manage storage costs while preserving critical insights [11].
Once your data is flowing, use historical baselines to train machine learning models. These models learn the natural patterns of your system, such as daily and weekly trends, enabling them to spot major deviations rather than just flagging breaches of static thresholds [1].
Next, integrate these models with your existing monitoring systems and assess their detection accuracy. Precision is key to avoiding false alarms, while recall ensures that real issues are identified. To further enhance efficiency, connect your alerting system to automated remediation actions. For example, you can configure it to trigger service restarts or rollbacks, significantly reducing Mean Time to Resolution (MTTR) [14][1].
Tools and Platforms for Automation
After setting up the basics, selecting the right tools can make your anomaly detection process even more effective.
Prometheus and Grafana are great for collecting and visualising metrics. You can use PromQL and recording rules within Prometheus to build anomaly detection mechanisms, eliminating the need for external tools [13][14]. By applying smoothing functions and filtering out metrics with low variability using a coefficient of variation threshold, you can reduce false positives during stable periods [13].
For a broader scope, platforms like Cisco AppDynamics and Datadog offer machine learning-based baselining and automated causal analysis across distributed microservices [1]. Tools like Sumo Logic and Splunk simplify log analysis by condensing thousands of log lines into actionable insights [12]. Meanwhile, Jaeger, a distributed tracing tool, helps you identify latency bottlenecks by tracking requests across microservices.
| Tool Category | Examples | Key Function in Anomaly Detection |
|---|---|---|
| Monitoring & Visualisation | Prometheus, Grafana, SigNoz | Scraping metrics, storing time-series data, and visualising anomalies |
| Full-Stack Observability | Cisco AppDynamics, Datadog | Causal analysis, root cause identification, and ML-based baselining |
| Log Analysis | Sumo Logic, Splunk | Identifying patterns in logs and distilling them into actionable items |
| Distributed Tracing | Jaeger | Tracking requests across microservices to pinpoint latency issues |
When choosing tools, prioritise those that support auto-instrumentation for popular frameworks. This allows you to capture essential data with minimal code changes [11]. It's also crucial to monitor Golden Signals
- latency, traffic, errors, and saturation. Pay particular attention to error-rate spikes, as they often signal more urgent issues than volume spikes [1][11]. In Kubernetes environments, using Pod Security Policies and Network Policies can help establish a declarative baseline, improving the accuracy of runtime anomaly detection [4].
Challenges and Best Practices
Common Challenges
Setting up anomaly detection in DevOps isn't as straightforward as it might seem. One of the toughest challenges is figuring out what normal
actually looks like. As Milvus explains:
The definition of an anomaly is context-dependent and often ambiguous. A sudden spike in network traffic can signal either a cyberattack or heightened legitimate activity [16].
For instance, a surge in traffic during a marketing campaign can look statistically identical to a DDoS attack.
Another issue is data quality and imbalance. Since anomalies are rare, training datasets often lean heavily towards normal behaviour. Missing data and noise can further degrade the performance of models [16]. On top of that, the lack of anomalous examples makes it hard to train models that can accurately identify outliers [3].
The complexity and scale of modern microservices add another layer of difficulty. As LogicMonitor notes:
DevOps teams today are challenged with the rapid growth and complexity of infrastructure. Managing those environments only through static thresholds becomes insufficient [18].
Additionally, models risk becoming outdated as systems evolve [3]. Many teams also face a shortage of specialised data science skills, which are often needed to deploy advanced deep learning models effectively [16] [19]. These challenges highlight the importance of adopting effective strategies.
| Algorithm Type | Sensitivity | Computational Cost | False Positive Rate | Best Use Case |
|---|---|---|---|---|
| Statistical (ARIMA/SARIMA) | Moderate | Low | Moderate | Time-series data with clear seasonality [18] |
| Clustering (k-means) | Low | Low | High | Simple datasets; struggles with subtle relationships [16] |
| Autoencoders (Deep Learning) | High | Moderate to High | Low (Robust) | Multivariate monitoring data in complex environments [15] [16] |
| RNNs / LSTMs | Very High | High | Moderate | Sequences with complex temporal dependencies [16] |
Best Practices for Success
Overcoming these challenges requires a thoughtful and consistent approach. Start by building clear baselines using historical data before attempting to identify anomalies [3]. Pay attention to the importance of different metrics - a spike in errors per second is far more critical than an increase in traffic volume [1]. This kind of contextual understanding can help distinguish between real threats and harmless events, like the seasonal traffic surge during Black Friday [3].
Consider using hybrid strategies. Combining unsupervised machine learning for detecting unknown threats with rule-based methods for predefined thresholds can improve accuracy and reduce false positives [3] [17].
Keep your models up to date. Retrain them regularly to account for daily and weekly patterns - daily seasonality can be identified in 2.5 days, while weekly trends take about 9 days [18] [3]. This helps prevent models from becoming outdated as systems evolve.
Involve development teams in the process. Use their feedback to label system-generated data and refine your models [15]. To speed things up, seed training data with known malicious patterns rather than waiting for such events to occur naturally [2]. Integrating anomaly detection into your CI/CD pipeline can also help you catch and address performance or security issues before they reach production [19].
For more tailored insights, you might want to explore the consultancy services offered by Hokstad Consulting (https://hokstadconsulting.com). They specialise in helping teams optimise their DevOps processes.
Conclusion
Detecting behavioural anomalies has become a key strategy in managing today’s cloud-native systems. By identifying unusual patterns early, teams can shift from simply reacting to issues to addressing them proactively, tackling potential threats and performance hiccups before they escalate.
The advantages stretch across performance, cost, and security. On the performance side, it helps reduce the Mean Time to Detect (MTTD) by catching irregularities in real time, stopping small glitches from snowballing into major outages. From a cost perspective, anomaly detection pinpoints unusual spending trends and underused resources, enabling teams to optimise infrastructure and save time otherwise spent manually tracking down issues. On the security front, it goes beyond traditional tools by identifying Indicators of Attack (IOAs), making it possible to catch zero-day threats and insider risks that signature-based systems might overlook [2].
Achieving success hinges on creating well-defined historical baselines [6]. Leveraging a mix of machine learning and rule-based methods can cut down on false positives, while regularly retraining models ensures systems keep pace with changing environments. Full-stack integration - spanning application performance monitoring, infrastructure management, and cloud cost oversight - delivers the visibility needed for complex microservices setups. This approach not only strengthens security and boosts efficiency but also sets the stage for long-term operational success.
For teams looking to refine their processes, experts like Hokstad Consulting offer tailored DevOps solutions. They can help streamline deployments and optimise cloud costs through strategic use of modern monitoring and anomaly detection tools.
FAQs
How does behavioural anomaly detection enhance security in DevOps?
Behavioural anomaly detection keeps an eye on user, host, and system activities to spot patterns that stray from the usual. By catching these unusual behaviours early, it can help block security threats that more conventional, signature-based methods might miss.
What makes this method stand out is its ability to speed up responses to potential risks by automating security actions. This minimises the chance of harm. It's especially useful in fast-changing environments like cloud-native systems, where traditional approaches often fall short in keeping up with constant shifts.
What are the most common machine learning algorithms used for detecting anomalies in DevOps workflows?
Machine learning plays a key role in spotting anomalies within DevOps workflows, helping teams address issues before they escalate. Some commonly used algorithms include statistical time-series models for analysing trends, clustering methods like k-means for grouping unusual patterns, and isolation forests for pinpointing outliers. More advanced techniques, such as one-class SVM and deep learning methods like autoencoders and LSTM networks, are particularly effective at handling complex, high-dimensional data.
These tools enable teams to closely monitor system behaviour, catch irregularities in real time, and keep operations running smoothly. This is especially valuable in cloud-native environments, where automation and scalability are essential.
How can behavioural anomaly detection be integrated into DevOps workflows?
Behavioural anomaly detection focuses on spotting unusual patterns in data, such as unexpected spikes in latency or abnormal resource usage. By weaving this into your DevOps processes, you can catch and resolve issues as they happen, ensuring systems stay reliable while supporting fast-paced deployments.
To get started, embed monitoring tools across your CI/CD pipeline. These tools should track key metrics, logs, and traces. Next, define what normal
looks like for critical indicators - like response times or deployment success rates - and set up automated alerts for any deviations. Pair these alerts with automated responses, such as rollbacks or scaling adjustments, using infrastructure-as-code tools. This approach ensures consistency and makes it easier to track changes.
For organisations in the UK, Hokstad Consulting offers guidance to make this process seamless. They can help you choose the best detection tools, design tailored solutions, and improve your incident response while keeping cloud costs under control.