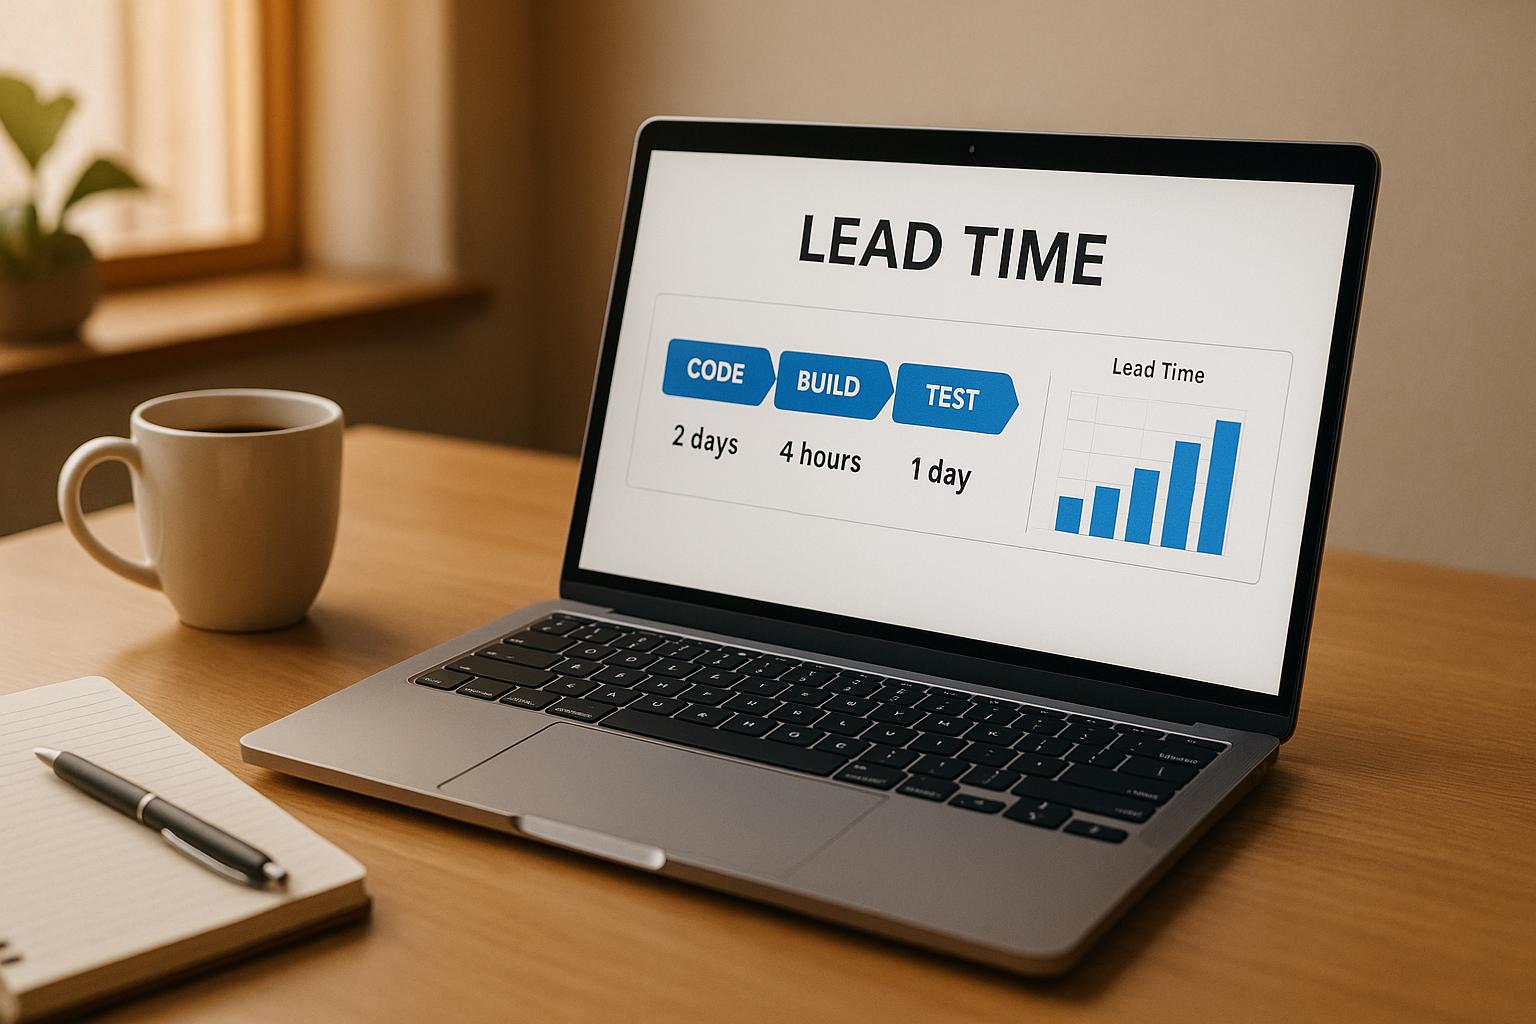
Lead time in DevOps measures the total time it takes from when a work item is created to when it’s deployed to production. It includes all stages: backlog waiting, active work, reviews, and deployment. Shorter lead times improve delivery efficiency, customer satisfaction, and operational performance. Here's what you need to know:
- Why it matters: Lead time helps identify delays, improve workflows, and benchmark team performance. Top-performing teams often achieve lead times under 24 hours.
- How it differs from cycle time: Lead time covers the full process, including waiting periods, while cycle time focuses on active work.
- Key stages: Backlog time, coding, review, and deployment.
- Measurement tips: Define clear start and end points, use automated tools, and analyse trends to tackle bottlenecks.
- Improvement strategies: Automate processes, streamline reviews, and adopt smaller batch sizes.
Consistently tracking and optimising lead time can transform your DevOps pipeline, making delivery faster and more predictable.
Lead Time vs Cycle Time
Definitions and Differences
To streamline DevOps workflows, it’s important to grasp the difference between lead time and cycle time. These two metrics focus on distinct parts of the development process and help identify performance bottlenecks.
Lead time represents the full customer experience. It measures the time from when a work item is created to when it’s completed and deployed. This includes everything - waiting periods, handoffs, and active work [1].
Cycle time, in contrast, focuses strictly on the active work phase. It tracks the time your team spends actively developing, testing, and deploying tasks once they’ve started [1].
The distinction lies in their scope. Lead time provides a broader perspective, including backlog delays, while cycle time zooms in on the efficiency of the development phase. If lead time reflects the customer’s wait for a feature, cycle time highlights how efficiently your team works on it.
| Metric | Scope | What It Includes | Primary Use |
|---|---|---|---|
| Lead Time | Full process | Backlog time + active work + waiting | Customer satisfaction, SLA tracking |
| Cycle Time | Active work only | Development, testing, deployment | Team efficiency, process improvement |
In practice, lead time helps estimate delivery schedules and monitor service-level agreements (SLAs). Cycle time, on the other hand, is useful for identifying bottlenecks and planning sprints effectively.
Next, we’ll dive into the stages that make up lead time and how they influence overall performance.
Stages of Lead Time Measurement
Breaking down lead time into stages allows teams to pinpoint delays and optimise processes from start to finish.
The clock starts when a work item is created - whether it’s a new feature in the backlog or a support ticket submitted by a customer.
Backlog waiting time is the first stage. This is the period between creation and the start of active work. During this time, items may sit in queues, waiting for prioritisation, resource allocation, or dependency resolution. Teams that excel at backlog management and prioritisation can significantly reduce this delay.
Once active work begins, cycle time kicks in. This phase is divided into four key stages [7]:
- Coding time: The time developers spend writing, modifying, and committing code. This includes initial development, bug fixes, and feature updates.
- Pickup time: The delay between code commits and the start of subsequent processes, such as automated builds or test environment setups.
- Review time: This includes code reviews, quality assurance testing, and approval workflows. Long review times could signal bottlenecks like limited reviewer availability or overly complicated processes.
- Deploy time: The period from when code is approved to its deployment in production.
Lead time ends when the code reaches a completed state, typically when it’s live in production and accessible to end users.
Improving each stage individually can have a significant impact. For example, reducing cycle time and managing backlog processes efficiently can dramatically shorten overall lead time.
High-performing teams often showcase the benefits of these optimisations. They measure lead time in hours rather than days, weeks, or months. These teams can deploy updates multiple times a day, while less efficient teams might only manage weekly or even monthly deployments [2].
Lead Time VS Cycle Time and How Kanban/Lean Can Help Continuous Delivery and DevOps
How to Measure Lead Time
Measuring lead time effectively involves a structured approach that turns raw data into meaningful insights. By following a clear process, you can build a framework that helps identify trends, address bottlenecks, and improve delivery performance.
Define Scope and Baseline
The first step in measuring lead time is deciding what exactly you want to track. One common approach is to measure lead time from the moment a code commit is made until it’s deployed to production [5]. This provides clear start and end points that are easy to monitor. Alternatively, some teams prefer to track lead time starting from when work is first scheduled in a project management tool [5]. This broader approach captures planning and prioritisation delays, offering a more comprehensive view of the customer experience.
Consistency is crucial here. You need to define when work officially starts and ends - and stick to it across all projects [5]. For instance, if you decide to start measuring when a feature request enters the backlog, ensure every team member applies this rule the same way. Without uniformity, your data won’t be reliable for spotting patterns or areas for improvement.
Make sure you’re collecting data in the same way across all teams and projects [4]. Whether it’s a minor bug fix or a major feature release, applying consistent measurement criteria ensures your data remains comparable and actionable. This consistency lays the foundation for improving workflows and speeding up delivery.
Set performance benchmarks to measure lead time effectively. Research shows that top-performing teams often achieve lead times of less than a day, whereas lower-performing teams may take weeks or even months [10]. Use these benchmarks to establish realistic goals for your team and track progress over time.
Once you’ve established a clear scope and baseline, the next step is choosing the right tools to support your measurement efforts.
Select and Configure Tools
The tools you choose play a big role in how effectively you can measure and improve lead time. Look for systems that integrate smoothly with your existing delivery pipelines. Tools designed for DevOps metrics can help identify bottlenecks and streamline workflows [9]. Ideally, these tools should connect with your CI/CD pipelines, issue trackers, and monitoring systems to automate data collection and eliminate manual input [8].
It’s also important that the tools present data in a way that’s easy to understand [8]. Platforms with customisable dashboards allow you to visualise lead time trends alongside other key performance indicators, giving you a clearer picture of your delivery process.
Involve your team when implementing new tools to ensure smooth adoption [9]. Gather feedback through developer surveys and team discussions to understand what’s working and what needs improvement [9]. Assign specific team members - often platform or DevOps engineers - to act as tool champions. These individuals can oversee the rollout, provide training, and ensure the tools continue to meet your needs as workflows evolve [9].
Start by identifying what you want to measure. Use team feedback, pipeline reviews, and surveys to align your measurement strategy with your improvement goals [9].
Measure and Analyse Data
Once your tools are in place, the focus shifts to collecting and analysing data. Automation is key here, as it ensures consistent and accurate data capture [11]. CI/CD platforms and version control systems can automatically log critical timestamps, creating a detailed audit trail for lead time calculations.
Analysing the data is where you’ll uncover insights. Use value stream mapping to pinpoint where delays are occurring - such as during hand-offs, queues, or review stages [10]. Visual tools like scatter charts and histograms can help you spot trends and outliers, revealing variability in lead times and how different types of work impact delivery times [10].
Regular reviews of your metrics are essential [11]. Monthly or quarterly check-ins often strike the right balance, providing enough data to identify trends without overwhelming your team. Focus on understanding why certain tasks took longer than others, rather than just celebrating quick turnarounds or criticising slower ones.
Compare your performance to industry benchmarks. For example, elite teams often achieve lead times under one day, while others may average one week to a month [10] [11]. These comparisons can help you set realistic improvement goals and track your progress.
Keep in mind that context is everything. A complex feature requiring rigorous testing will naturally take longer than a small configuration change. Instead of chasing speed alone, aim to make your lead times more consistent and predictable. This approach ultimately leads to smoother workflows and better outcomes.
Need help optimizing your cloud costs?
Get expert advice on how to reduce your cloud expenses without sacrificing performance.
Tools and Techniques for Lead Time Tracking
Tracking lead time effectively requires the right tools to transform scattered data into practical insights.
Popular Lead Time Tools
CI/CD platforms are essential for automating lead time tracking. They record timestamps at every stage of the delivery pipeline, from the first code commit to the final deployment. This automation ensures a clear view of the entire process.
Monitoring and observability tools add another layer by offering real-time insights into your delivery pipeline. These tools integrate with your existing systems, helping you track performance and pinpoint bottlenecks that could slow down lead times.
Internal Developer Portals (IDPs) simplify workflows by centralising data from multiple tools. This is crucial, especially considering that up to 75% of developers lose between 6 and 15 hours each week switching between tools [9]. By consolidating metrics and engineering metadata, IDPs provide a comprehensive overview of DevOps performance, reducing inefficiencies and saving time.
When choosing tools, focus on those that integrate smoothly with your current stack. Look for compatibility with your version control, issue tracking, and deployment systems. Scalability is also key - your tools should grow with your team and support multiple environments. Many providers offer trial periods, so take advantage of these to test how well a tool fits your workflows before committing.
Next, let’s look at the differences between manual and automated tracking methods.
Manual vs Automated Tracking
Automated tracking is the preferred choice for accurate and consistent data collection. Manual tracking, which relies on developers to record lead times, often introduces human error and bias. In contrast, automated systems deliver precise, consistent results with minimal effort.
| Aspect | Manual Tracking | Automated Tracking |
|---|---|---|
| Accuracy | Prone to human error and bias | Records exact timestamps and calculations |
| Time Investment | Requires ongoing developer input | Minimal setup, then runs independently |
| Data Consistency | Varies between team members | Standardised across all projects |
| Scalability | Difficult to manage as teams grow | Handles increased volume effortlessly |
| Real-time Insights | Delayed reporting cycles | Immediate updates and availability |
Automated tracking also aligns with industry benchmarks, where top-performing teams often measure lead times in hours rather than days or weeks [2]. For example, CI/CD pipelines enable elite teams to deploy code nearly 1,000 times more frequently than their lower-performing peers [5]. Automated testing further speeds up the process by replacing manual reviews with automated quality checks, ensuring standards are met without human intervention.
Using Dashboards for Monitoring
Dashboards turn raw lead time data into actionable visual insights, helping teams make informed decisions. By integrating with CI/CD systems, issue trackers, and monitoring tools, dashboards offer a unified view of delivery performance. Visual aids like scatter plots can highlight variability in lead times, while histograms show distribution patterns, making it easy to spot trends or inconsistencies.
Automated reporting is another powerful feature. Setting up weekly or monthly reports keeps stakeholders informed without adding extra administrative work. These reports can highlight key metrics, compare performance over time, and flag potential issues.
Alerts are also invaluable. By setting thresholds based on established benchmarks, such as resolving system failures within an hour for high-performing teams [2], you can ensure quick responses to problems. Notifications can be sent the moment lead times exceed acceptable limits, allowing teams to act promptly.
When implementing dashboards, aim to reduce tool-switching for developers. Choose platforms that integrate seamlessly into your team’s existing workflow, delivering insights where they’re needed without adding unnecessary complexity.
How to Use Lead Time Data
Once you've gathered lead time data using tracking tools and dashboards, the next step is to dive into the numbers. Analysing this data can uncover patterns in your delivery pipeline and highlight areas that need improvement.
When bottlenecks emerge through this analysis, focus on making targeted changes to address them.
Finding Bottlenecks and Outliers
Think of lead time data as a diagnostic tool. When you see consistently high lead times, it's a clear signal that something in your process needs attention. Pay close attention to the most critical metrics to guide your evaluation.
Understanding where your team's performance stands is key. If lead times are regularly on the higher end, there's room to make things more efficient. For instance:
- Lead times over 7 working days signal a need for immediate action.
- Lead times under 3 working days are considered good.
- Elite teams often achieve lead times of less than 24 hours [13].
Value stream mapping is a great way to pinpoint delays. This method helps you identify queues, hand-offs, and review stages that slow down your software delivery [10]. Once you've spotted these bottlenecks, you can prioritise the necessary changes.
High lead times might be caused by issues like large batch sizes, slow code reviews, lengthy quality assurance processes, or extended CI/CD wait times [13]. Analysing outliers - those unusual spikes in lead time - can also reveal irregularities in your workflows.
Improving Workflows with Lead Time Data
The goal of using lead time data isn't to assign blame - it's to improve processes [5]. Use these insights to make meaningful changes that enhance efficiency.
One effective way to reduce lead times is through automation. By automating build, test, and deployment processes with CI/CD pipelines, you can speed up delivery [5]. Continuous deployment takes this a step further by automatically releasing commits once they've passed testing [5].
Test automation is another critical tool. It catches issues early, cutting down on delays caused by manual reviews [5].
To simplify and speed up development, consider adopting loosely coupled architectures. These allow for independent testing and deployment, reducing the complexity of merging code [5].
Optimising the review process can also make a big difference. Strategies like setting clear review guidelines, using dedicated code review tools, or adopting pair programming can reduce delays. Keeping pull request sizes under 200 changes also helps streamline reviews [3][12].
For even faster workflows, implement lightweight change approval processes. This removes unnecessary bureaucracy, letting developers merge and deploy code without waiting on external reviews or slow approval boards. Quality remains intact, but delays are minimised [5].
Here's a quick reference table for performance and actions:
| Lead Time Range | Performance Level | Recommended Actions |
|---|---|---|
| Less than 24 hours | Great | Maintain current practices and ensure consistency |
| Less than 3 working days | Good | Introduce automation and reduce batch sizes |
| Greater than 7 working days | Needs attention | Conduct a full process review to eliminate bottlenecks |
To keep workflows smooth, it's also important to protect flow time. Developers need uninterrupted periods to focus on their work, balanced with a reasonable meeting schedule [5]. Proper resource management helps prevent bottlenecks and keeps progress steady [3].
Practices like trunk-based development and working in small batches allow developers to get quick feedback on their code, making it easier to spot and fix issues [2]. High-performing teams excel by acting quickly on feedback at every stage of the process [2].
Finally, continuous improvement is at the heart of DevOps [2]. Regularly monitoring lead time metrics ensures you stay on top of inefficiencies and adjust as your processes evolve [6]. By using these insights, your team can consistently refine its workflows and achieve faster, more reliable delivery [5].
Conclusion
Main Points
Measuring lead time is one of the most important metrics for refining DevOps workflows and meeting continuous delivery objectives. As Tom Hall, DevOps Advocate & Practitioner, puts it:
DevOps metrics are data points that directly reveal the performance of a DevOps software development pipeline and help quickly identify and remove any bottlenecks in the process[2].
Getting lead time measurement right allows teams to respond swiftly to market demands and customer needs [6]. For instance, teams with lead times under an hour can deploy code 973 times more often than those with longer ones [5].
Having the right tools in place is essential for consistent monitoring and making adjustments that improve both efficiency and quality over time [3]. Lead time data helps managers make well-informed decisions about resource allocation and process changes [3], while also enabling teams to better estimate delivery timelines for new features [3].
Ultimately, lead time plays a key role in enhancing deployment efficiency, which has a direct impact on customer satisfaction, time to market, and overall agility [6]. Regularly tracking and analysing lead time metrics helps teams identify bottlenecks and optimise their software delivery processes for faster, more dependable results.
These findings underline the value of expert assistance in driving meaningful change.
How Hokstad Consulting Can Help
To turn these insights into actionable outcomes, expert guidance can make all the difference. Hokstad Consulting excels in streamlining DevOps workflows and can help your organisation set up reliable lead time tracking systems that yield tangible improvements.
Their services include building automated CI/CD pipelines and advanced monitoring solutions, making lead time measurement straightforward and precise. Hokstad Consulting also specialises in cutting cloud costs by 30–50% while improving deployment cycles, offering customised solutions for public, private, hybrid, and managed hosting setups.
For organisations aiming to achieve high-performing DevOps metrics, Hokstad Consulting’s blend of technical know-how and hands-on implementation can transform lead time tracking from a manual effort into an automated, data-driven process that fuels continuous improvement.
FAQs
How do automation and smaller batch sizes help reduce lead time in DevOps?
Automating processes in DevOps takes the hassle out of repetitive manual tasks, speeding up workflows and ensuring faster feedback and deployment cycles. This means changes can transition from development to production much more quickly, cutting down lead times significantly.
By working with smaller batch sizes, testing and deployment become faster and more manageable. Smaller changes are easier to validate, making it simpler to catch and fix issues early on. This proactive approach avoids the bottlenecks often caused by larger, more complicated updates. Together, automation and smaller batch sizes boost efficiency and adaptability, keeping your DevOps workflows running smoothly and effectively.
What are the best tools for tracking lead time in DevOps, and how can they fit into existing workflows?
Tracking lead time in DevOps becomes much easier with tools that fit smoothly into your current workflows. One standout option is Azure DevOps, which features built-in lead time and cycle time charts. These charts provide real-time metrics directly on its dashboards, allowing teams to pinpoint delays and fine-tune their processes.
You can also integrate tools like Grafana, Datadog, and New Relic into your CI/CD pipelines using APIs or plugins. These platforms offer detailed visualisations and analytics, making it easier to spot bottlenecks and drive continuous improvements in your deployment cycles.
Incorporating these tools into your workflows ensures precise tracking and delivers actionable insights to help refine your DevOps processes. The result? Faster delivery and smoother operations.
How do lead time and cycle time differ, and why is it important to understand this in DevOps?
Understanding the distinction between lead time and cycle time plays a key role in boosting team performance and keeping customers happy. Lead time refers to the total time it takes from when a customer makes a request to when it’s fulfilled. It’s a measure of how quickly your processes respond to customer needs. On the other hand, cycle time zeroes in on the time required to complete a specific task once work has begun, offering insight into how efficiently your team operates.
Focusing on reducing cycle time allows teams to accomplish tasks more effectively, while trimming down lead time ensures faster delivery to customers. Together, these metrics shine a light on workflow bottlenecks, help streamline processes, and improve the overall customer experience - paving the way for happier customers and stronger business results.