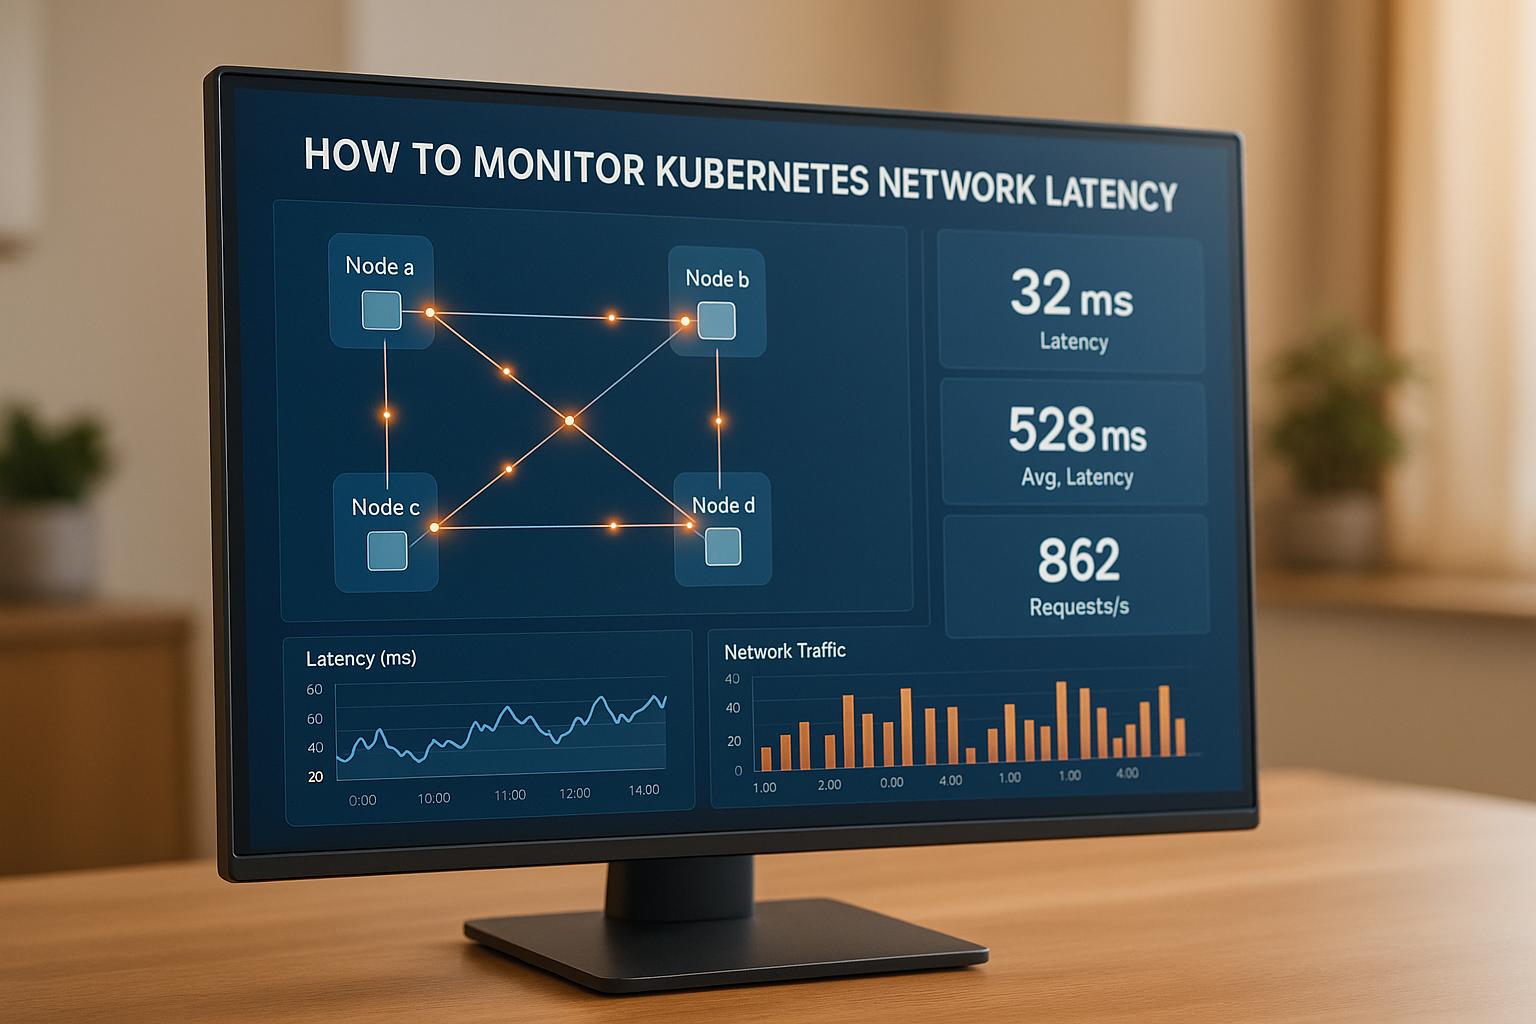
Monitoring Kubernetes network latency is essential for ensuring your applications run smoothly and efficiently. Latency refers to the time it takes for data to travel between pods, services, and external endpoints. High latency can degrade performance, increase cloud costs, and impact user experience. Here's a quick summary of what you need to know:
- What Causes Latency: Pod-to-pod communication, service mesh overhead, DNS resolution delays, cross-zone traffic, and load balancer processing.
- Key Metrics to Track: Request duration (P50, P95, P99), round-trip time (RTT), DNS resolution time, connection setup time, and packet loss percentage.
- Tools to Use:
- Prometheus: Collects and analyses latency metrics.
- Grafana: Visualises data with custom dashboards.
- Kubenurse: Monitors pod-to-pod and service connectivity.
- KubeShark: Provides detailed network packet analysis.
- Steps to Monitor Latency:
- Deploy Prometheus and Grafana for metrics collection and visualisation.
- Use Kubenurse for real-time network health checks.
- Set up alerts to catch latency spikes early.
- Analyse historical data to identify patterns and improve performance.
Unmasking Kubernetes Network Bottlenecks with eBPF (Ishan Jain)
Understanding Kubernetes Network Latency
Kubernetes network latency stems from the delays introduced by various network components. By identifying these sources, it's easier to locate bottlenecks and address performance issues. Below, we break down the common factors that contribute to these delays in Kubernetes clusters.
Common Causes of Network Latency in Kubernetes
Pod-to-pod communication often accounts for a significant portion of network latency. When pods on different nodes communicate, packets must travel through the Container Network Interface (CNI), the host network stack, and even physical network layers. Overlay networks like Flannel or Calico can add further delays due to the additional encapsulation they require.
Service mesh overhead is another contributor. Service meshes such as Istio enhance security and observability by adding sidecars for tasks like encryption and traffic monitoring. However, these proxy layers can accumulate delays, particularly in microservices-heavy architectures.
DNS resolution delays can arise when Kubernetes DNS queries travel from the kubelet to CoreDNS (or kube-dns) and, at times, external servers. When caching is insufficient, repeated lookups increase latency, especially for applications that frequently connect to databases or external APIs.
Cross-availability zone traffic adds delays as data must traverse designated ingress points between zones. This routing can significantly impact performance in multi-zone deployments.
Load balancer processing introduces another layer of latency. Internal and external load balancers add delays through tasks like health checks, connection pooling, and SSL termination, all of which can slow down request handling.
Important Metrics for Measuring Latency
To effectively monitor and troubleshoot network latency, focus on these key metrics:
Request duration: This measures the time taken from when a request is made to when a response is received. Tracking percentiles like P50, P95, and P99 helps identify outliers. Monitoring this metric across different layers - such as ingress controllers, service meshes, and applications - provides a comprehensive view of latency.
Round-trip time (RTT): This metric captures the time it takes for data to travel between two endpoints and back. Network probes can help separate transit delays from application-level delays, especially useful for diagnosing issues in inter-region or cross-cloud setups.
Connection establishment time: This tracks how long it takes to set up a connection, including SSL handshakes or authentication steps. In environments with service meshes or complex network policies, this can become a noticeable factor in overall latency.
DNS resolution time: This measures the time taken for DNS queries to resolve. Delays here can indicate caching problems, which are particularly impactful in Kubernetes environments where DNS is critical for service-to-service communication.
Packet loss percentage: Even small amounts of packet loss can lead to retransmissions and backoff mechanisms, amplifying latency. Monitoring this metric is essential for diagnosing intermittent performance issues and ensuring network reliability.
These metrics are vital for understanding how latency impacts application performance, as outlined below.
How Latency Affects Applications
User experience degradation is a direct consequence of network delays. Even slight latency can frustrate users, especially in customer-facing applications like e-commerce platforms, where delays can lead to lost revenue and reduced satisfaction.
Cascade failures become a real risk when high latency triggers retries that overload upstream services. This can lead to a domino effect, overwhelming otherwise functional components and causing widespread application failures. While retry and circuit breaker mechanisms can help, they aren't foolproof, making robust latency monitoring essential.
Resource waste and cost inflation often result from misinterpreted network delays. For example, increased CPU wait times or memory pressure caused by latency might prompt teams to scale up unnecessarily, adding to cloud costs. Accurate monitoring can help distinguish between actual capacity needs and network-related issues.
Database connection exhaustion is another common problem. Network delays can deplete shared database connection pools, especially in microservices architectures. This leads to queued requests or outright failures, disrupting application performance.
Timeout cascades occur when intermittent latency spikes cause unexpected timeouts. These can lead to unpredictable application behaviour and complicate troubleshooting, as such issues are difficult to replicate without detailed monitoring.
Understanding and addressing these latency factors is critical for maintaining efficient and reliable Kubernetes-based applications. By keeping a close watch on the metrics and causes outlined here, teams can minimise disruptions and optimise performance.
Tools for Monitoring Kubernetes Network Latency
Choosing the right tools to monitor Kubernetes network latency is essential for keeping your cluster running smoothly. With various options available, understanding their strengths and limitations helps teams craft an effective monitoring strategy.
Popular Latency Monitoring Tools
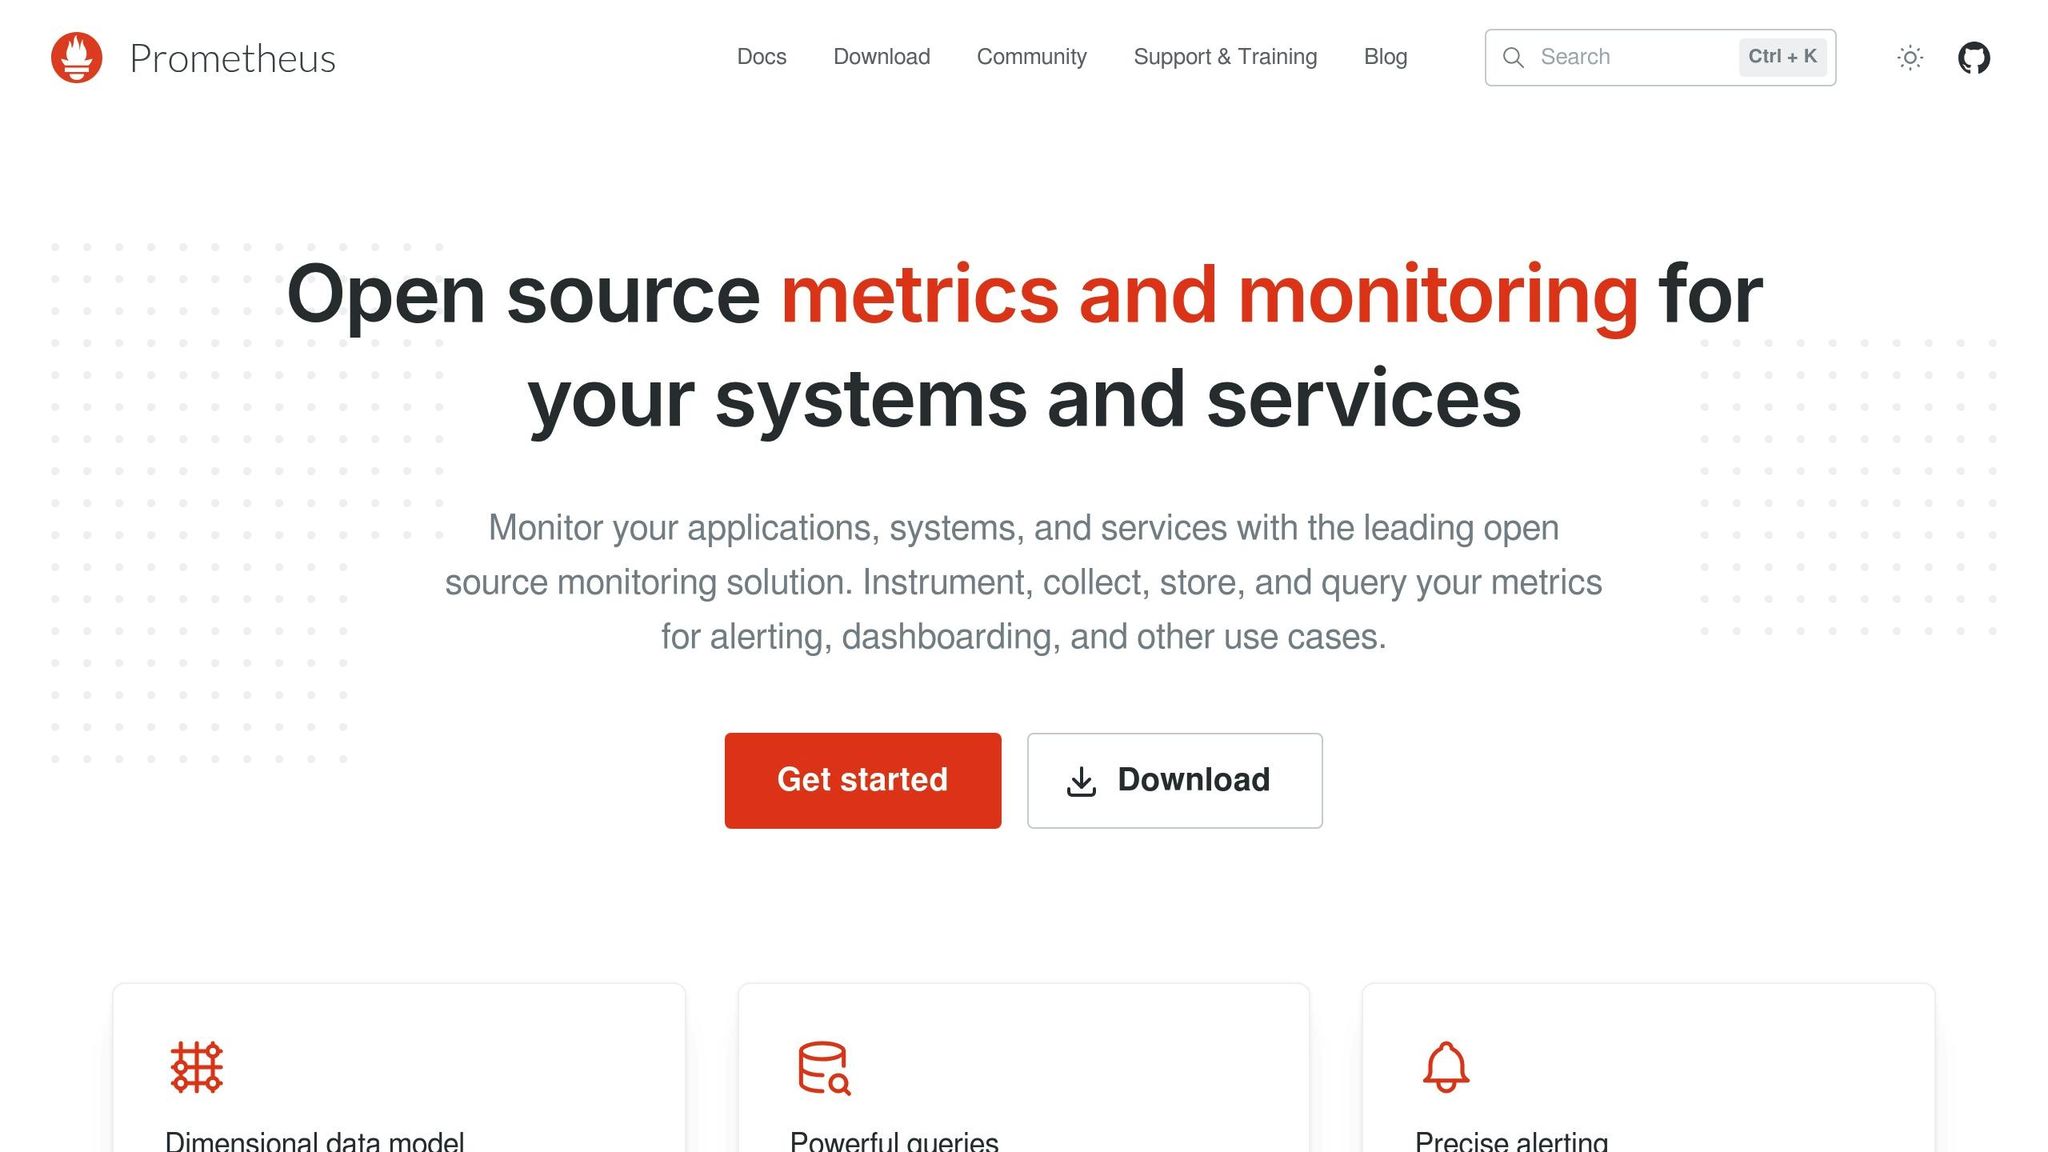
Prometheus is a powerful open-source tool for gathering metrics across your cluster. Using a pull-based model, it scrapes data from endpoints, making it ideal for collecting network latency metrics from applications, services, and infrastructure. Its PromQL query language allows for detailed analysis of latency trends and patterns.
Grafana works hand-in-hand with Prometheus to visualise latency data. It lets you create custom dashboards with charts, graphs, and alerts, making it easier to track real-time metrics and quickly identify latency spikes across services and time periods.
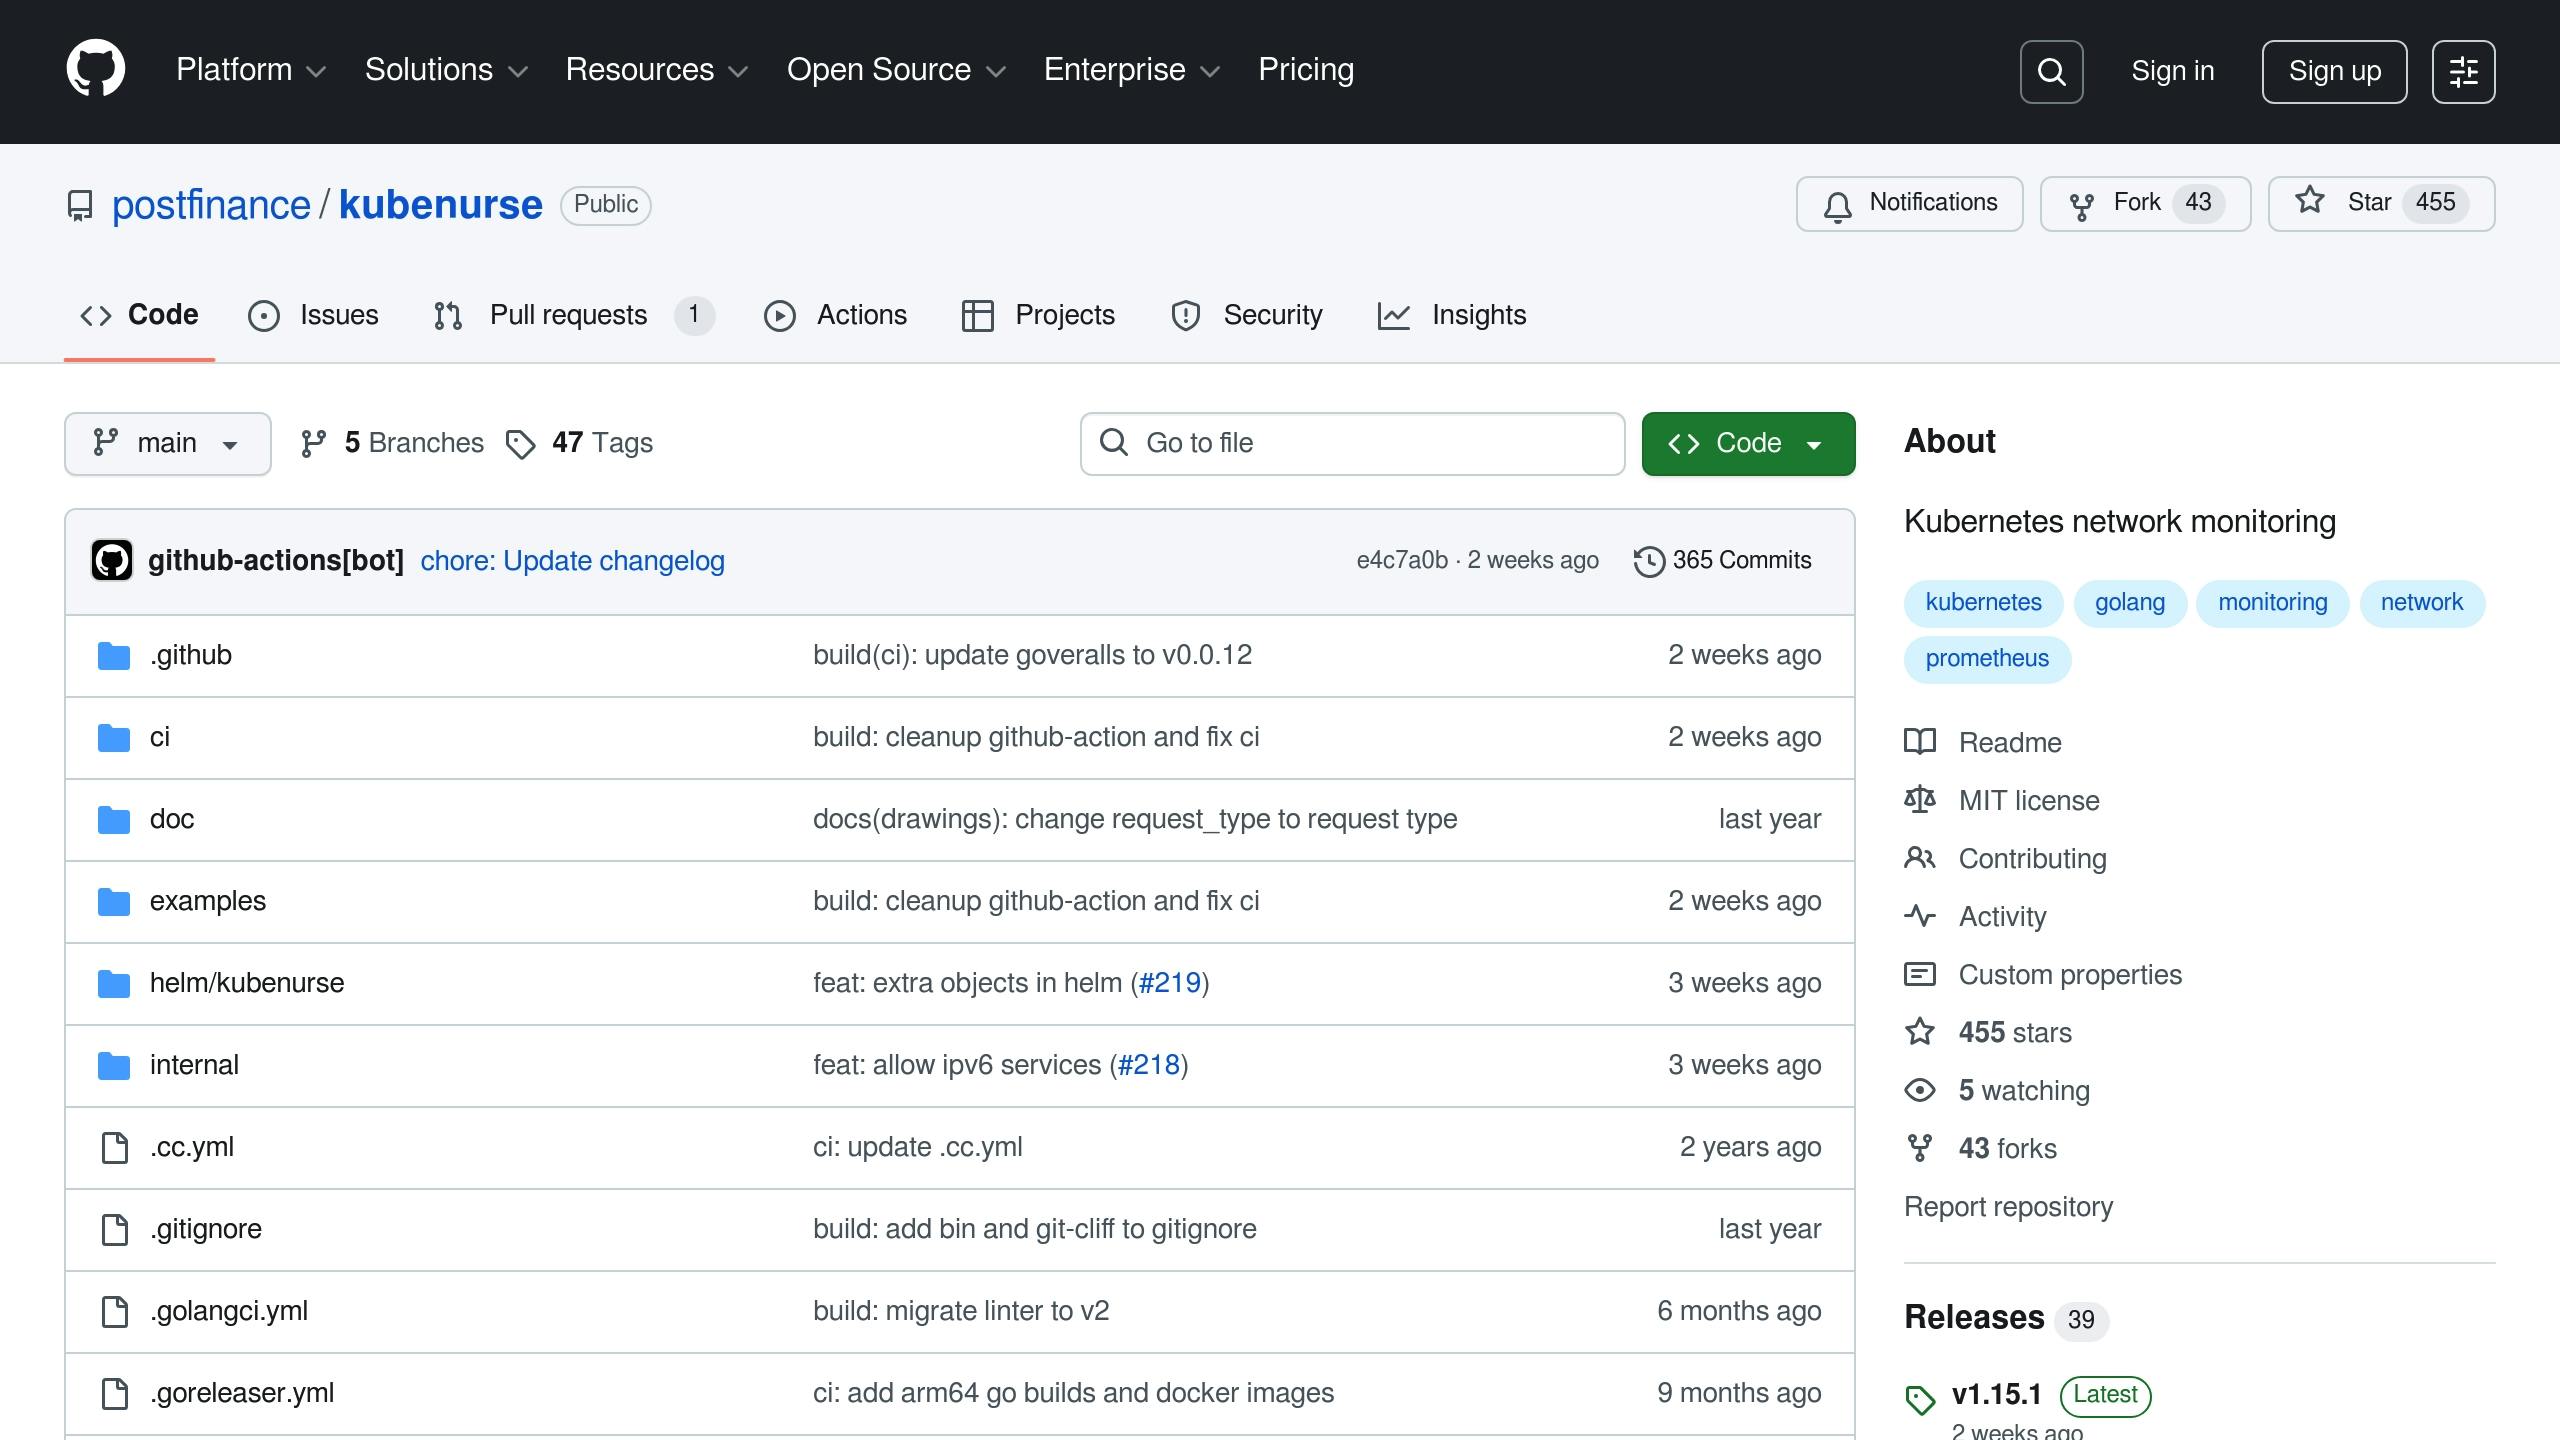
Kubenurse is a lightweight tool designed specifically for monitoring Kubernetes network health. Running as a DaemonSet, it performs continuous health checks, measuring latency in pod-to-pod, pod-to-service, and external connectivity scenarios. This setup ensures comprehensive node coverage and provides detailed insights into network performance from multiple angles.
KubeShark brings in-depth network packet analysis to Kubernetes. It captures and analyses traffic in real time, offering a clear view of communication patterns between services. Its ability to decode application-layer protocols makes it an excellent choice for troubleshooting latency issues at the protocol level.
Tool Comparison
| Tool | Key Benefits | Limitations | Best Use Cases |
|---|---|---|---|
| Prometheus + Grafana | Extensive metrics collection, flexible querying, cost-effective | Requires setup expertise, storage management overhead | General monitoring, custom metrics, cost-conscious setups |
| Kubenurse | Kubernetes-native, easy to deploy, continuous checks | Limited features, basic connectivity testing | Cluster health checks, basic latency monitoring |
| KubeShark | Real-time packet capture, protocol-level insights | Resource-heavy, steep learning curve | Troubleshooting, protocol analysis, security reviews |
Choosing the Right Tool
Reducing latency is a top priority, so your choice of tools should align with your environment's performance needs. High-traffic setups with strict latency requirements might benefit from enterprise-grade solutions offering automated analysis and predictive capabilities. For smaller clusters, open-source tools can deliver excellent results without the added costs.
Your team's expertise plays a big role too. While Prometheus and Grafana offer unmatched flexibility, they require solid configuration skills to set up effectively. On the other hand, tools like Kubenurse are simple to deploy and start delivering results quickly, making them suitable for teams with less experience in monitoring.
Budget is another key factor. Open-source tools such as Prometheus and Grafana are free to use but may demand more internal resources for setup and maintenance. Commercial solutions, while more expensive, can save time with easier implementation and professional support.
Integration with existing systems is also important. If you're already using Prometheus for application monitoring, extending it to include network latency is a logical step. Similarly, organisations with established monitoring platforms should evaluate how new tools will fit into their workflows.
For regulated industries, compliance and reporting needs could influence your decision. Enterprise tools often provide better audit trails and reporting features compared to open-source alternatives.
In many cases, the best approach combines multiple tools. For example, Prometheus and Grafana can manage broad monitoring needs, while specialised tools like KubeShark handle detailed troubleshooting when required. This blend ensures both a wide overview and targeted insights into your Kubernetes network performance.
Need help optimizing your cloud costs?
Get expert advice on how to reduce your cloud expenses without sacrificing performance.
Step-by-Step Guide to Monitoring Kubernetes Network Latency
Here's how you can set up and configure tools to keep track of network latency in your Kubernetes cluster.
Setting Up Prometheus and Grafana
To begin monitoring latency effectively, you’ll need to deploy Prometheus and Grafana. Start by installing the Prometheus Operator, which comes with Custom Resource Definitions (CRDs) for Prometheus, Alertmanager, and ServiceMonitor components, along with a controller [1][4]. This operator streamlines deployment and simplifies configuration management.
- Configure RBAC: Create a ServiceAccount linked to a ClusterRole that grants Prometheus permissions to
get,list, andwatchresources like nodes, services, endpoints, pods, configmaps, and ingresses [1][4]. - Deploy Prometheus: Use a
Prometheuscustom resource to set up your server with two replicas. Specify the image version, resource requests, and ServiceAccount details [1][4]. This redundancy ensures monitoring continues even if one instance fails. - Expose Prometheus: Use a ClusterIP Service on port 9090 to allow internal cluster access. You can also port-forward to access the Prometheus web interface and verify metrics collection or query latency data [1][4].
For network latency monitoring, create ServiceMonitor resources. These instruct Prometheus on which services or pods to scrape for metrics. Examples include node exporters for infrastructure data, application endpoints for custom latency metrics, or eBPF exporters for network-level performance insights [1][2][3].
Next, install Grafana using the kube-prometheus-stack Helm chart. Port-forward to access its interface and import pre-built or custom dashboards [1][2][3][6]. Together, Prometheus and Grafana provide a powerful foundation for tracking latency metrics.
Using Kubenurse for Real-Time Monitoring
Kubenurse is a helpful tool for monitoring network health in real time. It measures request durations, tracks errors, and exports metrics in a Prometheus-friendly format [5].
- Deploy Kubenurse: Set it up as a DaemonSet on every node [5]. Kubenurse performs various health checks, including:
- Direct API server access
- API server DNS resolution
- Connectivity via Ingress and Kubernetes Services
- Communication between Kubenurse instances [5]
- Integrate with Prometheus: Configure Kubenurse to expose its metrics at a standard endpoint. Then, create ServiceMonitor resources to include these metrics in your Prometheus setup.
To visualise this data, build custom dashboards in Grafana. These dashboards can display pod-to-pod communication times, service response latencies, and external connectivity metrics. They’ll help you spot patterns and detect anomalies in your cluster’s network behaviour.
Once Kubenurse is up and running, you can set up alerts to address latency issues proactively.
Setting Up Alerts and Troubleshooting
Alerts can help you tackle latency problems before they escalate. Configure Prometheus to trigger alerts based on thresholds. For instance, you might set a warning alert for communication delays over 100ms and a critical alert for delays exceeding 500ms.
When an alert fires, use your monitoring dashboards to investigate. Check metrics to see if latency is affecting specific pods, nodes, or network paths. Look for timing patterns and correlate them with latency spikes. From there, examine resource usage, network policies, and DNS resolution to locate bottlenecks.
Best Practices for Reducing Kubernetes Network Latency
Once you've set up monitoring and alerts, the next step to reducing latency is leveraging historical data for long-term performance improvement. This approach complements real-time monitoring by offering insights into patterns and trends that emerge over time.
Using Historical Data
Analysing historical data helps uncover long-term trends and recurring latency patterns within Kubernetes clusters. This deeper understanding provides a clearer picture of your cluster's overall health and efficiency.
Start by establishing baselines that define normal traffic behaviours and performance benchmarks. With tools like Prometheus and Grafana, you can create dashboards to track these benchmarks over weeks or months. These baselines act as reference points, making it easier to detect anomalies when performance deviates from the expected norms.
Historical data also aids in spotting patterns. For instance, you may notice latency spikes that occur at specific times of the day, align with deployment activities, or follow seasonal traffic trends. Recognising these patterns allows you to take proactive steps to address issues before they escalate, rather than reacting after problems arise.
Another benefit of historical analysis is its role in resource management. By understanding recurring latency spikes, you can make informed decisions about autoscaling and node sizing. This ensures resources are allocated efficiently, preventing both over-provisioning and performance bottlenecks. Historical data also enhances post-incident analysis by correlating performance metrics with event logs, deployment schedules, and configuration changes. This makes identifying root causes easier and helps you avoid similar problems in the future.
To stay ahead, create dashboards that track weekly, monthly, and quarterly performance trends. These views can highlight gradual changes or performance declines that may not be immediately visible through real-time monitoring, giving you the chance to address capacity planning needs before they become urgent.
Conclusion and Next Steps
Main Takeaways
Monitoring latency effectively is crucial for maintaining performance and keeping users happy. This guide has explored how latency affects applications, from slowing response times to reducing user satisfaction. By identifying common culprits - like DNS resolution delays, poor traffic routing, and resource bottlenecks - you can lay the groundwork for a strong monitoring framework.
The right tools and a systematic approach are essential for managing latency. Tools such as Prometheus and Grafana provide detailed metrics and visualisations, while Kubenurse offers real-time insights into cluster health. Setting up alerts ensures you can address issues before they impact users.
Analysing historical data is equally important for long-term performance improvements. Establishing baselines and spotting trends in cluster behaviour helps you make smarter decisions about resource allocation, capacity planning, and infrastructure upgrades. This proactive approach minimises potential problems.
By combining real-time monitoring with historical analysis, you can improve your cluster's performance and prevent issues before they arise. Implement these strategies to build a more resilient infrastructure, and if needed, turn to experts for guidance in optimising your setup.
How Hokstad Consulting Can Help
Hokstad Consulting builds on these principles to deliver tailored solutions for improving Kubernetes performance. Effective latency monitoring requires a mix of DevOps expertise and cloud optimisation, and Hokstad Consulting specialises in helping UK businesses achieve just that.
Our cloud cost engineering services are designed to cut infrastructure costs by 30–50%, all while enhancing performance through better resource allocation and smarter traffic routing. We also provide automated CI/CD pipelines, comprehensive monitoring, and ongoing infrastructure support via flexible retainer models.
Whether you're looking for help with strategic cloud migration, bespoke development, or continuous DevOps support, we offer solutions for public, private, hybrid, and managed hosting environments. Our expertise also includes AI strategy implementation and automation, which can further refine your monitoring processes and operational efficiency.
For businesses keen to optimise their Kubernetes infrastructure without upfront costs, our No Savings, No Fee
model ensures you only pay based on the actual cost reductions achieved. This makes professional DevOps transformation both accessible and results-driven. Let us help you achieve measurable improvements while keeping your infrastructure running smoothly.
FAQs
How can I check if network latency in my Kubernetes cluster is affecting users and what can I do to address it?
To determine if network latency in your Kubernetes cluster is affecting user experience, keep an eye on key metrics like response times, throughput, and packet loss. Tools such as Prometheus or other monitoring platforms can help you spot potential problems early. High latency can lead to slower responses, diminished service quality, and unhappy users.
To tackle network latency, you can fine-tune your network settings. Adjusting TCP/IP configurations, setting optimal MTU values, and using high-performance container network interfaces (CNIs) - like those based on eBPF - can make a noticeable difference. Regularly track network throughput and packet drops to detect and address issues before they grow. Adding redundancy and fault-tolerant components can also boost both reliability and performance.
If your business needs expert assistance, Hokstad Consulting provides customised solutions to optimise Kubernetes clusters, enhance performance, and improve user satisfaction.
How can I integrate Prometheus and Grafana into my Kubernetes cluster to monitor network latency effectively?
To monitor network latency in Kubernetes using Prometheus and Grafana, begin by deploying the Prometheus Operator. Using a tool like Helm can streamline this process, ensuring automatic service discovery across your cluster. Configure Prometheus to gather metrics from critical endpoints, paying special attention to network latency and application performance. Use appropriate labels and annotations to fine-tune the data collection.
Once Prometheus is set up, install Grafana. You can either use pre-built dashboards or design custom ones to track metrics like latency, traffic, and error rates. Dashboards focused on golden signals are particularly useful for gaining real-time insights. Make it a habit to update your dashboards and alerting rules regularly to keep up with changing needs. For deeper analysis, leverage PromQL queries to examine specific latency trends and uncover potential bottlenecks.
These steps provide a robust framework for monitoring and analysing network latency in your Kubernetes setup effectively.
How can analysing historical data help identify long-term network latency issues in Kubernetes, and what trends should I monitor?
Understanding historical data is crucial for pinpointing long-term network latency issues in Kubernetes. It reveals patterns and trends, such as recurring latency spikes or anomalies tied to resource usage or network adjustments. By analysing this information, you can tackle potential problems early, preventing them from escalating.
When reviewing trends, pay attention to consistent latency increases, performance drops during peak periods, and links to configuration changes or scaling activities. Tools and dashboards that display historical metrics visually can simplify the process, helping you anticipate future challenges and fine-tune performance effectively.