When cloud costs spiral out of control, it’s often because forecasting processes are outdated or incomplete. To avoid budget overruns and align expenses with business goals, you need a structured approach to predict cloud spending. Here’s a quick rundown of the five key steps to improve accuracy:
- Analyse Historical Data: Collect 12–18 months of billing data, normalise it, and identify usage trends. Use tags and governance tools to ensure data consistency.
- Identify Cost Drivers: Break down internal, external, strategic, and reverse demand factors influencing costs. Quantify their impact for better predictions.
- Build Forecasting Models: Combine trend analysis with driver-based adjustments, factoring in pricing models like Reserved Instances and Savings Plans.
- Monitor Continuously: Set up real-time alerts, conduct weekly variance reviews, and plan for different scenarios to adjust forecasts as needed.
- Review and Refine: Conduct monthly and quarterly reviews, engage experts for insights, and track progress through forecasting maturity levels.
Key takeaway: By following these steps, you can reduce forecast variance from over 20% to as low as 5–12%, providing better financial control and reducing unnecessary cloud spending.
::: @figure 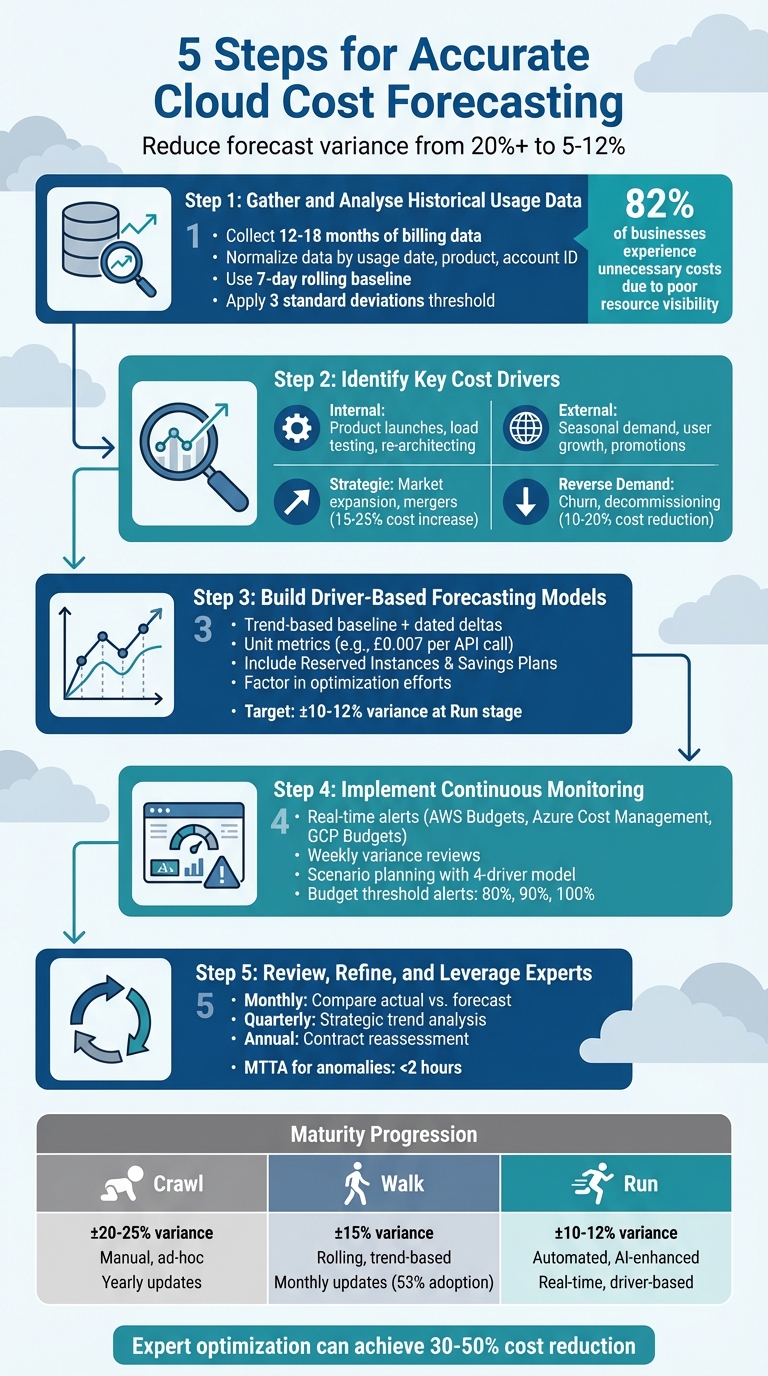 {5 Steps for Accurate Cloud Cost Forecasting Process}
:::
{5 Steps for Accurate Cloud Cost Forecasting Process}
:::
Forecasting Cloud Costs FinOps FOCUS and Power BI
Step 1: Gather and Analyse Historical Usage Data
To create reliable cloud cost forecasts, start by collecting 12–18 months of billing data. This period is long enough to capture seasonal trends, growth patterns, and any unusual events that could otherwise distort your predictions. For example, AWS Cost and Usage Reports (CUR) 2.0 offers a structured schema with up to 125 columns, making it a helpful tool for this step.
Consistency is key, so normalise your data by grouping it into categories like usage start date, product name, and usage account ID. If you're operating in the UK, convert historical costs to GBP to avoid exchange rate fluctuations skewing your analysis. Export the data with daily or monthly granularity to ensure consistency across your review periods.
Collect Normalised Billing Data
Use your cloud provider's reporting tools to pull billing data, ensuring it's properly tagged and categorised from the start. Tags like CostCenter, Project, and Environment should be embedded in your Infrastructure as Code (IaC) templates, such as Terraform or CloudFormation. This ensures resources are provisioned with the right metadata, reducing the risk of missing information.
Cloud-native governance tools like AWS Config or Azure Policy can help enforce tagging standards. These tools flag resources missing mandatory tags, which is crucial because 82% of businesses with public cloud workloads have experienced unnecessary costs due to poor resource visibility [5]. Regular audits - either monthly or quarterly - can help identify orphaned resources and backfill missing tags, keeping your data clean and reliable.
It's also important to understand how different platforms handle tag propagation. For instance, in Azure Databricks, tags applied to pools or workspaces may not automatically carry over to underlying compute resources unless restarted [4]. Being aware of these quirks ensures you don’t miss critical data during collection.
This clean and consistent dataset will serve as the foundation for spotting key usage trends in the next step.
Identify Usage Trends and Patterns
Once you’ve normalised your data, establish a seven-day rolling baseline to detect spikes and anomalies in usage. By comparing current daily costs to this rolling average and applying a threshold of three standard deviations, you can filter out normal fluctuations and uncover genuine trends.
Look for patterns such as monthly billing cycles, reduced weekend usage, quarter-end processing surges, or seasonal demand shifts. This process can also help you spot underutilised resources that inflate costs without providing value. Getting this step right is crucial, as accurate data collection and normalisation lay the groundwork for all future forecasting efforts.
Step 2: Identify Key Cost Drivers
Once you've analysed your historical data, the next move is identifying what influences your cloud spending. These influences, or cost drivers, can be grouped into four categories: internal (like product launches, demo or pre-production environments, load testing, feature rollouts, or re-architecting), external (such as seasonal demand spikes during events like Black Friday, user growth, promotions, or free trials), strategic (including market expansion or mergers), and reverse demand (like customer churn, decommissioning workloads, or optimisation efforts) [1][2].
Why does this matter? Internal drivers are tied to your engineering plans - things you can manage and prepare for. External drivers, on the other hand, depend on market trends and customer behaviour, making them less predictable and requiring scenario planning. Strategic drivers often lead to cost increases of 15–25% due to initiatives like entering new regions or handling additional workloads. Meanwhile, reverse demand drivers, such as shutting down unused environments, can trim costs by 10–20% annually [1][2]. To keep things manageable, classify these drivers for easier tracking and analysis.
Classify Internal and External Drivers
To begin, gather details from deployment calendars, infrastructure change logs, and product roadmaps. Internal drivers might involve scaling projects that add £10,000 per month in compute costs or adjusting Kubernetes requests/limits, which could temporarily increase spending by 20–50% during implementation [1][2]. External drivers, on the other hand, might include seasonal sales events like Prime Day or Christmas, which can cause storage and compute demands to surge by 30–100% [1].
A four-bucket classification model can help you organise these drivers. Assign each driver to specific scopes in your Configuration Management Database (CMDB), tagging them to relevant applications, environments, or teams. This method ensures thorough tracking and helps you monitor the effects over time.
Quantify Impact of Drivers
Once you've categorised your drivers, the next step is to assign measurable details to each one. Include attributes like scope, timeline, estimated cost change, and ownership [2]. For instance, adding a new region might increase costs by £5,000 per month, while planned optimisations could offset a £50,000 seasonal surge [1][2].
Turning general predictions into concrete forecasts is a game-changer. As Erik Peterson, AWS Optics team lead, advises:
Start with a trend-based baseline to capture what's already in motion. Then layer in assumptions based on these drivers as they become known - ideally before they hit production[2].
Step 3: Build Driver-Based Forecasting Models
Once you've identified your cost drivers, the next step is to create forecasting models that convert historical trends and expected future events into accurate cost predictions. The best approach combines a trend-based baseline with dated deltas - specific events like product launches, migrations, or decommissioning [6][7]. The baseline reflects ongoing trends, while the dated deltas account for upcoming changes. Together, they help ensure your cost forecasts align closely with actual events.
Using unit metrics, such as cost per API call, can make financial projections highly precise. For example, if each API call costs £0.007, forecasting an additional 2,000,000 API calls per month would predict an operating cost increase of about £14,000. Let’s say a SaaS product currently handles 1,500,000 API calls per month at a cost of £11,000 (around £0.007 per call). If the business anticipates 2,000,000 additional API calls monthly, this model enables a clear estimate of the resulting cost increase [6].
Don’t forget to include optimisation efforts, like rightsizing, instance shifts, or storage tiering, as dated events in your forecast. The FinOps Foundation highlights the importance of this:
Optimisation efforts must be included in forecasts to maintain trust in the model. Otherwise, variance will show up as unexplained[7].
For organisations at a mature Run
stage, the goal is typically to maintain a forecast variance of ±10–12% [7].
Incorporate Pricing Models
Your forecasts should reflect actual contract terms instead of list prices. This means factoring in Reserved Instances (RIs), Savings Plans, and Enterprise Agreement terms to ensure unit rates match what you’re actually paying [7]. Amortised or blended rates can help distribute upfront costs accurately over the forecast period [7].
Pricing changes, such as purchasing a new RI or moving to a cheaper instance family, should be treated as dated events with clear start dates and ramp-up logic [7]. Joe Daly from the FinOps Foundation emphasises this point:
Forecasting without amortised pricing is like budgeting on list price. You're miles off and don't know why[7].
For new product launches, pricing calculators can be invaluable for modelling both one-off setup costs and recurring lifecycle expenses [6].
Compare Forecasting Methods
Once you’ve accounted for actual pricing details, it’s time to evaluate which forecasting method works best for your workload. Trend-based forecasting assumes past patterns will continue and is ideal for stable, predictable workloads [7]. On the other hand, driver-based forecasting focuses on identifying business events that will trigger new spending, making it more suitable for scenarios like product launches, migrations, or seasonal spikes [6][7]. The most effective approach often combines both methods: start with a trend-based baseline to capture ongoing momentum, then layer in driver-based adjustments for upcoming events [6][7].
| Factor | Trend-Based Forecasting | Driver-Based Forecasting |
|---|---|---|
| Logic | What happened in the past will continue |
What business events will drive new spend |
| Best Use Case | Stable, linear growth workloads | New launches, migrations, or seasonal spikes |
| Accuracy | Moderate (40–60% variance) | High (if drivers are quantified) |
Step 4: Implement Continuous Monitoring and Scenario Planning
A forecast is only as good as its ability to stay relevant in a constantly changing cloud environment. While accurate historical data and driver-based models are essential, their value diminishes without regular updates. Continuous monitoring and scenario planning ensure your forecasts stay aligned with reality. Otherwise, they risk becoming outdated and unreliable.
Set Up Real-Time Tracking
Waiting for monthly reviews can be too slow to catch potential issues. Instead, set up real-time alerts to flag when usage trends approach or exceed your monthly budget. This provides a critical opportunity to make adjustments before costs spiral out of control. Most major cloud platforms offer built-in tools to help with this:
- AWS: Budgets and CloudWatch
- Azure: Cost Management and Advisor
- GCP: Budgets and Alerts
Additionally, schedule weekly variance reviews with your Finance, Engineering, and FinOps teams. These meetings allow you to compare actual costs against forecasts and refine your assumptions as needed. This combination of real-time insights and regular reviews creates a strong foundation for effective scenario planning[7].
Develop Scenario Plans
Once you have real-time tracking in place, the next step is to build forward-looking scenario plans. These plans help you anticipate and manage both steady growth and unexpected demand surges. Use the 4-driver bucket model to categorise potential changes:
- Internal drivers: Examples include launching new product features or expanding into new regions.
- External drivers: Factors like vendor pricing changes or new regulations.
- Strategic drivers: Decisions such as purchasing Reserved Instances or migrating to different instance families.
- Reverse drivers: Actions like decommissioning outdated applications[7].
Erik Peterson highlights the importance of making driver-based adjustments proactively - ideally before production even begins[7]. To further refine your forecast, model optimisation efforts (e.g., rightsizing or switching storage tiers) as time-based deltas with clear start dates and ramp-up logic. The goal is to reduce forecast variance from ±20–25% during the Crawl stage to ±10–12% by the Run stage[7].
This structured approach ensures your forecasts remain accurate, actionable, and adaptable to change.
Step 5: Review, Refine, and Leverage Expert Optimisation
Even the most advanced forecasting models need regular upkeep. Without consistent reviews and adjustments, forecasts can become outdated as business conditions change. A structured schedule for reviews helps catch discrepancies early and incorporates expert insights to keep your forecasts accurate.
Conduct Regular Forecast Reviews
Monthly reviews are essential for maintaining forecast accuracy. These reviews compare your predictions against actual costs, helping you identify where the model fell short. Bring together your FinOps, Engineering, and Procurement teams to analyse the reasons behind variances. Was there an unexpected product launch or a pricing shift you didn’t anticipate? Each variance provides an opportunity to refine your assumptions.
In addition to monthly reviews, quarterly strategic reviews can help you track broader trends that might not be visible in monthly data[9]. These sessions are also a good time to benchmark against historical performance. Annual reviews remain crucial for reassessing major contract commitments and long-term fiscal goals[8][9]. Be prepared for event-driven reviews as well, especially during periods of organisational change.
To stay ahead of potential issues, set budget threshold alerts at 80%, 90%, and 100% of your forecast. These alerts can trigger proactive reviews and prevent costs from spiralling out of control[10]. For organisations at the Walk
maturity level, updating forecasts monthly is common practice, with 53% adopting this approach[8]. At this stage, aim for a Mean Time to Acknowledge (MTTA) for cost anomalies of under two hours[10].
These review processes ensure your forecasts remain aligned with changing business conditions, reinforcing the driver-based approach discussed earlier.
Engage Cloud Cost Engineering Experts
After conducting reviews, the next step is to bring in expert insights to further refine your forecast. Accuracy improves significantly when Finance, Procurement, and Engineering teams work together. This is where cloud cost engineering expertise plays a key role. Experts help align technical and business objectives[12][7]. They also establish a FinOps rhythm and adjust assumptions in real-time[7].
For example, Hokstad Consulting offers services like cloud cost audits, automation, and optimisation, often achieving cost reductions of 30–50%. Their approach incorporates reverse drivers - factors like customer churn, planned decommissions, and optimisation timelines - into forecasting models[11][7]. They also ensure forecasts reflect amortised costs from Reserved Instances and Savings Plans, rather than unblended rates, so your predictions align with actual contract terms[7].
Forecast Maturity Levels
With ongoing monitoring and expert input, you can track your organisation’s progress through different forecast maturity levels. This progression helps refine your model’s accuracy over time. At the Crawl stage, forecast variances are typically around ±20–25%, relying on manual, ad-hoc methods. Moving to the Walk stage reduces variance to ±15%, thanks to rolling, trend-based forecasts on a regular schedule. Organisations at the Run stage achieve variances of ±10–12% by using automated, driver-based, AI-enhanced models[13][7].
| Maturity Level | Forecast Variance Target | Forecasting Method |
|---|---|---|
| Crawl | ±20–25% | Manual, ad-hoc, trend-based[7] |
| Walk | ±15% | Rolling, trend-based, regular cadence[13][7] |
| Run | ±10–12% | Automated, driver-based, AI-integrated[13][7] |
If your organisation uses AI-based forecasting models, ensure they are retrained regularly with updated data. This prevents data drift and keeps your forecasts aligned with the evolving complexities of your cloud environment. By making forecasting an ongoing process rather than a one-time task, you can transform it into a continuous cycle of Inform, Optimise, Operate
[8].
Conclusion
Turning cloud cost forecasting into a data-driven process removes the guesswork from budgeting. By analysing historical usage data, pinpointing cost drivers, creating predictive models, maintaining continuous monitoring, and seeking expert guidance, organisations can shrink forecast variance from over 20% to a more manageable 5–12% [3]. This improved accuracy brings greater financial control, curbs overspending, and ensures cloud investments align with business objectives.
Over time, your forecasting process can grow more refined. The shift from basic yearly updates with high variance to advanced, near real-time models is a gradual one. It starts with establishing historical baselines, progresses through monthly trend-based forecasting, and culminates in driver-based models that adapt dynamically to changes [3]. Each step builds on the last, integrating data and context to improve precision.
Regular reviews are key to maintaining this accuracy, giving engineering teams ownership while ensuring finance teams remain confident. This collaboration strengthens alignment across departments.
For businesses managing intricate multi-cloud setups or those in earlier stages of forecasting maturity, expert help from Hokstad Consulting can accelerate progress. Their services - ranging from cloud cost audits to automation and optimisation - often deliver cost savings of 30–50%, aligning forecasts with actual contract terms and ongoing improvements.
FAQs
What data do I need to start forecasting cloud costs?
To estimate cloud costs accurately, start by collecting at least 12 months of historical spending data. This helps you spot usage patterns and trends over time. Pay close attention to key cost categories such as computing, storage, networking, and managed services. It's also important to distinguish between fixed and variable costs, as well as to review past bills for any seasonal changes in spending. Tools like AWS Cost Explorer or Azure Cost Management can make it easier to extract and analyse this data efficiently.
How do I turn business plans into measurable cost drivers?
To turn business plans into measurable cost drivers, start by pinpointing the key activities and KPIs that directly impact cloud spending. These might include things like product launches or patterns of resource usage. From there, break these elements down into specific, quantifiable metrics and align them with cost categories such as computing, storage, or networking.
Dive into historical data to uncover patterns and relationships between these activities and expenses. Use these insights to refine your forecasting models, ensuring they deliver accurate, actionable predictions that stay in step with your strategic goals.
How can I keep my cloud cost forecast accurate as usage changes?
To keep your cloud cost forecasts on point, blend historical data analysis with real-time monitoring. Begin by examining at least 12 months of past cost data. This helps you spot trends and seasonal shifts that could impact spending. Use forecasting tools to identify patterns and estimate future expenses. For workloads that fluctuate, AI-powered monitoring can adjust predictions in real time, letting you respond quickly to changes and keep your budget on track.