Prompt Chaining vs Single Prompts: Costs and Trade-offs
Compare prompt chaining and single prompts by balancing accuracy, latency, tokens, privacy and cost per successful task.
Read moreBlog posts in the Cost Management category

Compare prompt chaining and single prompts by balancing accuracy, latency, tokens, privacy and cost per successful task.
Read more
Compare five preemptible VM models for render farms to find true cost per finished frame, accounting for retries and deadline risk.
Read more
Use native cloud billing first; add open-source tools only to fill gaps for multi‑cloud, Kubernetes, governance or reporting.
Read more
Compare seven Kubernetes rightsizing tools by control model, automation and cost impact to pick a safe, practical fit for your team.
Read more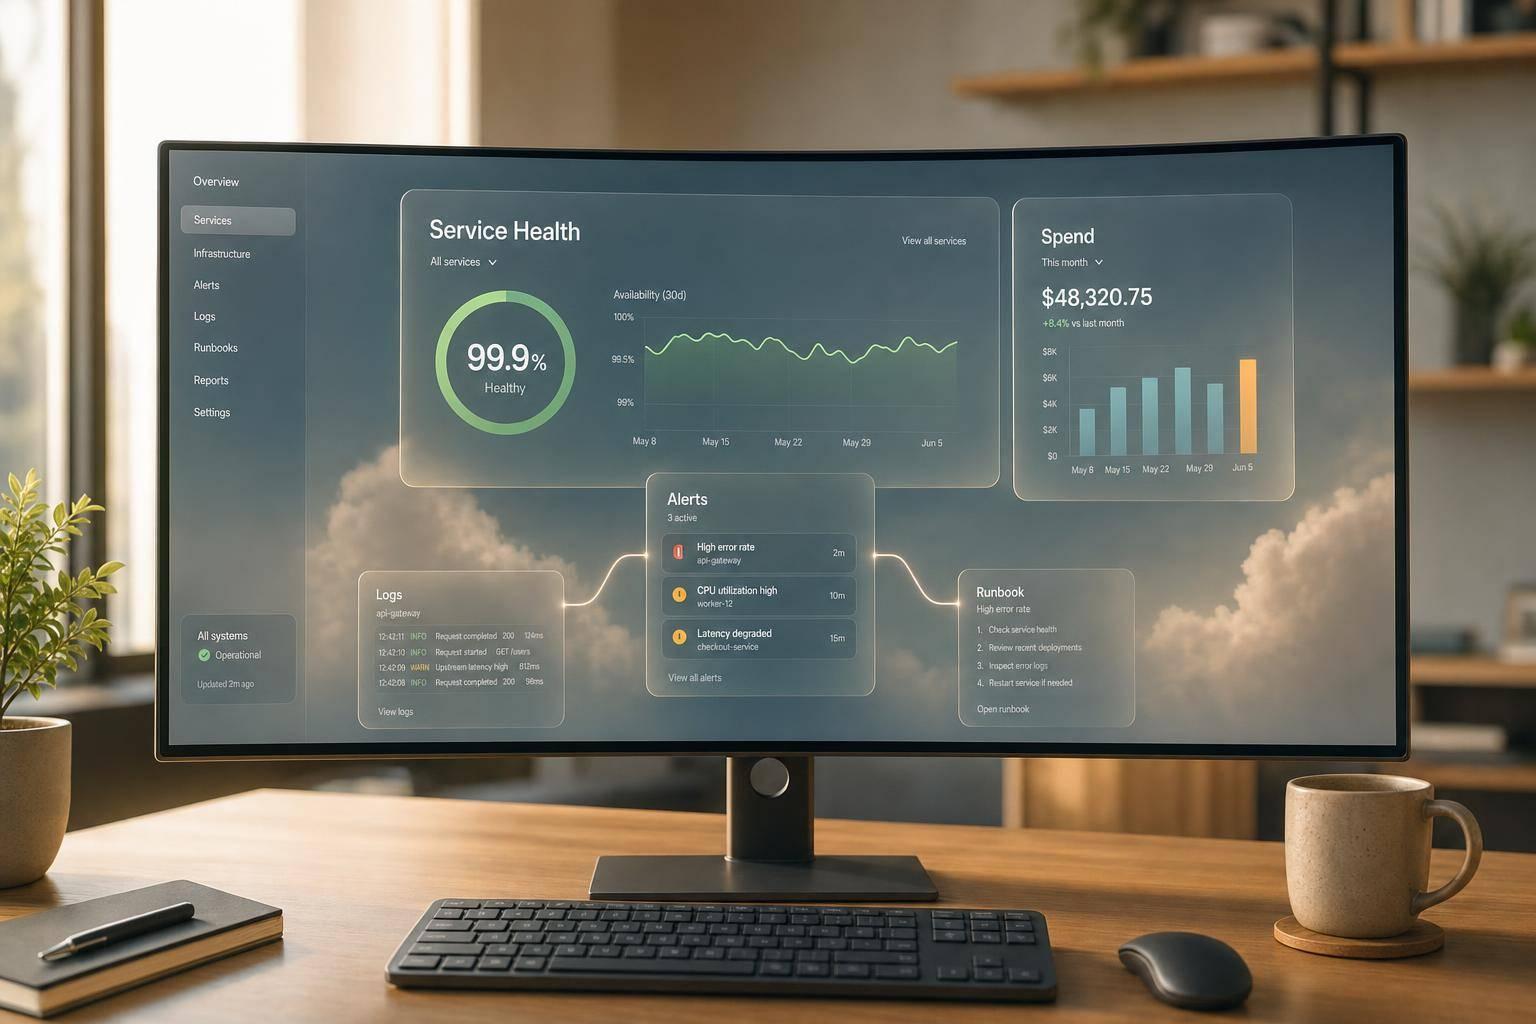
Design role-based cloud dashboards that prioritise service health and spend, link alerts to logs and runbooks, and reduce noise.
Read more
Compare shared vs dedicated CI runners by total delivery cost—minutes, queue delays, developer wait time and upkeep.
Read more
Send fewer, smaller and better‑routed events to cut cloud event costs—shrink payloads, cap retries, limit fan‑out and tighten retention.
Read more
Size cloud commitments to the steady AI usage floor, favour inference, use 60–90 day baselines and stagger renewals.
Read more
Reduce GPU idle costs by running steady baseline capacity and bursting spikes to cloud; use spot GPUs, queue-led autoscaling and region controls.
Read more
Ten practical steps to cut hybrid cloud spend: centralise visibility, rightsize compute, tier storage, curb egress and assign ownership.
Read more
Compare seven AI cloud-cost forecasting tools for finance, engineering and Kubernetes use cases.
Read more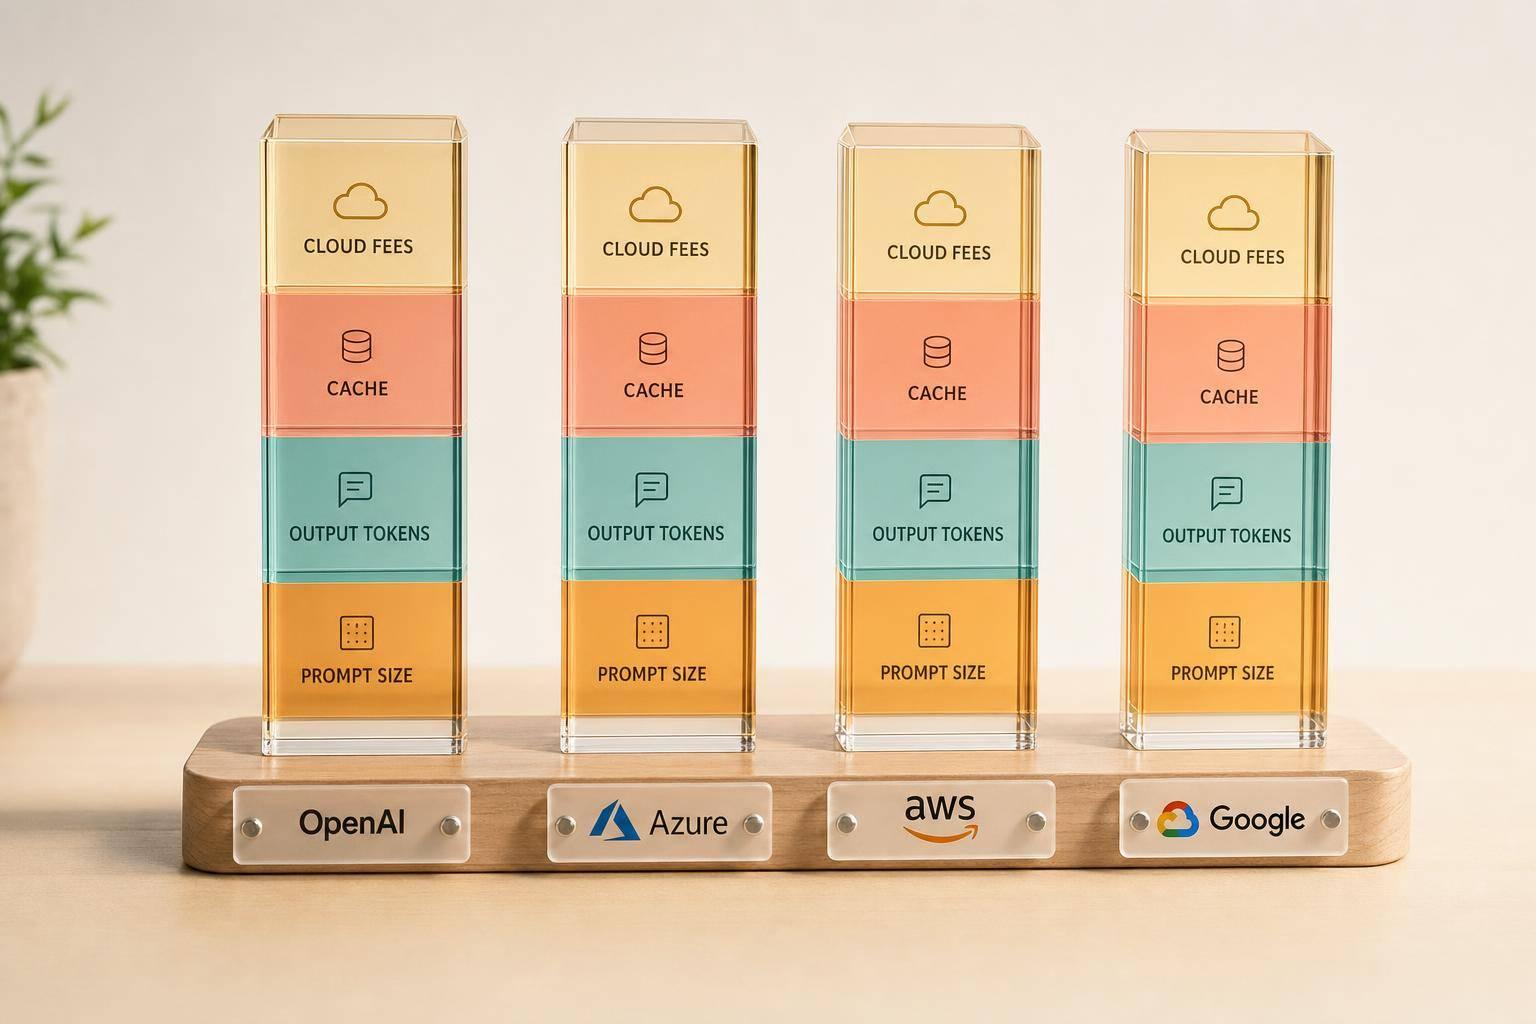
Measure LLM costs by real workloads - prompt size, output, cache and cloud fees usually decide the monthly bill.
Read more