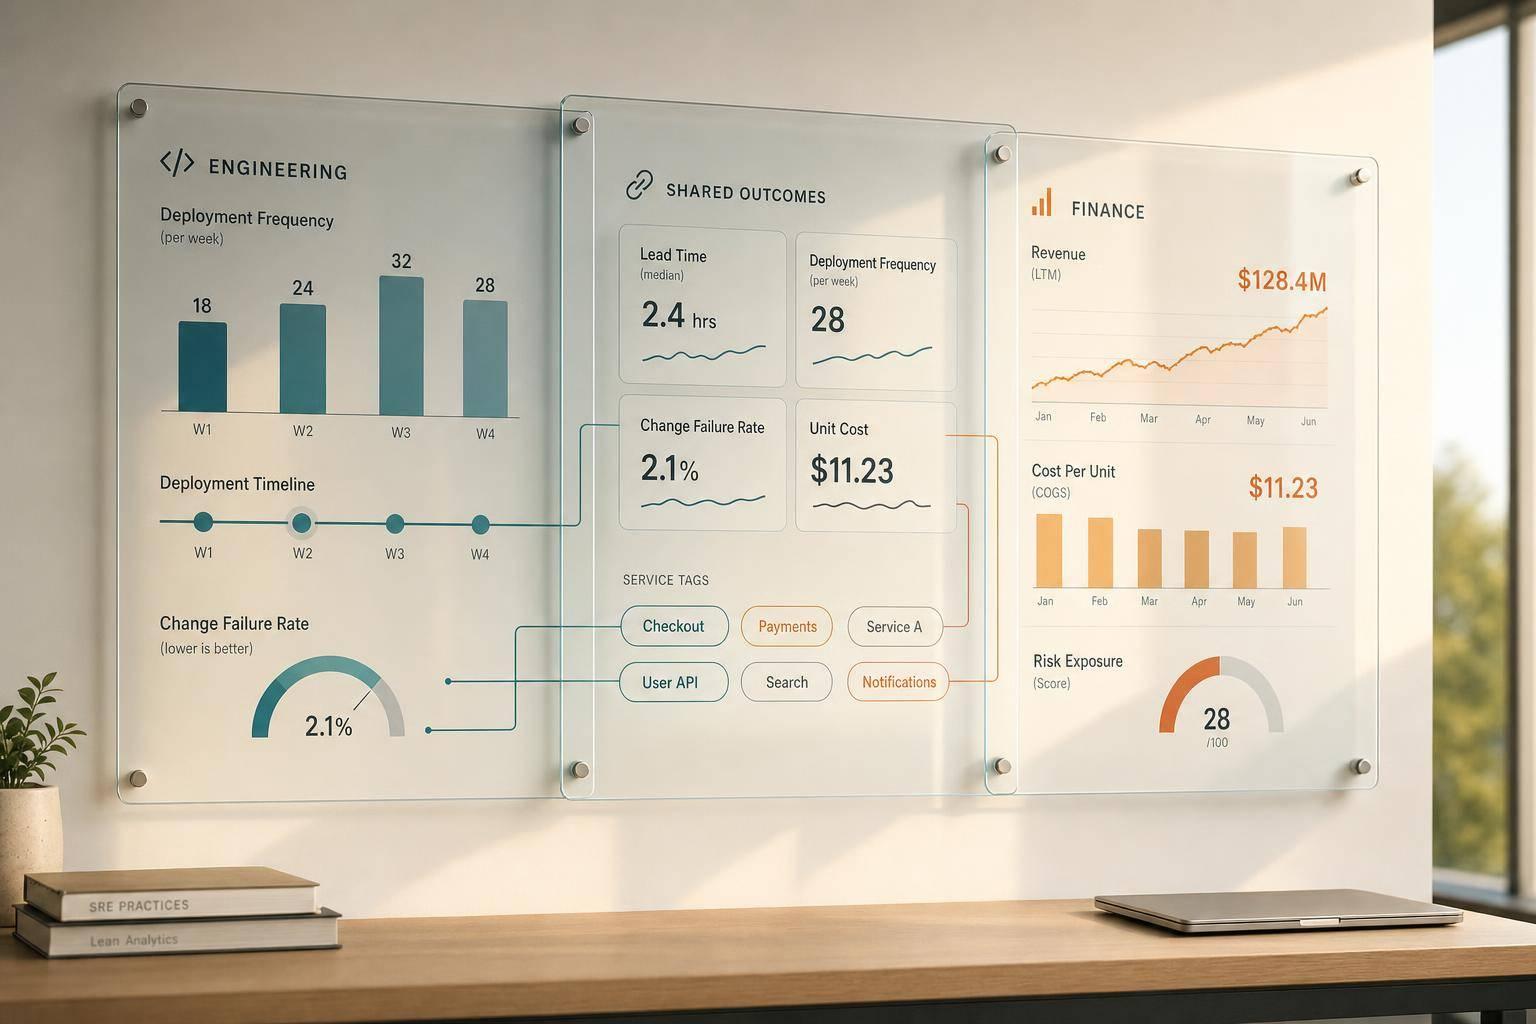
If your deployment metrics do not link to £ revenue, £ cost, or £ risk, board teams will not use them.
I’d sum the article up like this: you should connect each delivery metric to one business result, track that link with shared tags and IDs, and review it in the same monthly and quarterly cycles Finance already uses. That means turning lead time into time-to-value, MTTR into revenue protection, change failure rate into rework cost, and cloud spend into margin impact.
Here’s the short version:
- Deployment frequency alone is weak. More deploys do not always mean more business value.
- DORA metrics need a £ view. Boards care about MRR, conversion, churn, gross margin, CAC, LTV, and cloud spend.
- MTTR should be shown as money at risk. A drop from 120 minutes to 30 minutes only matters if you show the £ revenue saved.
- Change failure rate should include more than P1 incidents. If CFR is 15%, then about 15% of engineering spend may be going into rework.
- Cloud waste can wipe out delivery gains. The article notes 20–40% of cloud spend may be wasted, and 60% of firms may fail to control cloud costs through 2028 without automation.
- Shared tagging is the base layer. If CI/CD, billing, analytics, and finance tools do not use the same IDs, you cannot tie a release to conversion, retention, or cost.
- One dataset should serve three views: board, product, and engineering.
- Start with a written revenue hypothesis. Before work starts, define what business result should change and how you will measure it.
A few examples make the point clear:
- A release to checkout should be tied to conversion rate or refund reduction
- A change to signup or onboarding should be tied to activation or new MRR
- A fall in MTTR should be tied to £ revenue protected per hour
- A rise in CFR should be tied to £ spent on fixes, rollbacks, and credits
- A rise in cloud spend per transaction should be tied to gross margin pressure
| Metric | What I’d show instead |
|---|---|
| Deployment frequency | Features or outcomes per £ spent |
| Lead time | Time-to-market or cost per feature |
| Change failure rate | Rework cost and refund exposure |
| MTTR | Revenue lost or protected per hour |
| Cloud cost | Cost per transaction and margin effect |
Bottom line: I would not report delivery speed on its own. I’d report revenue growth, revenue protection, cost reduction, and risk reduction - then show which deployment metrics moved those numbers.
That is the core idea behind the article.
::: @figure 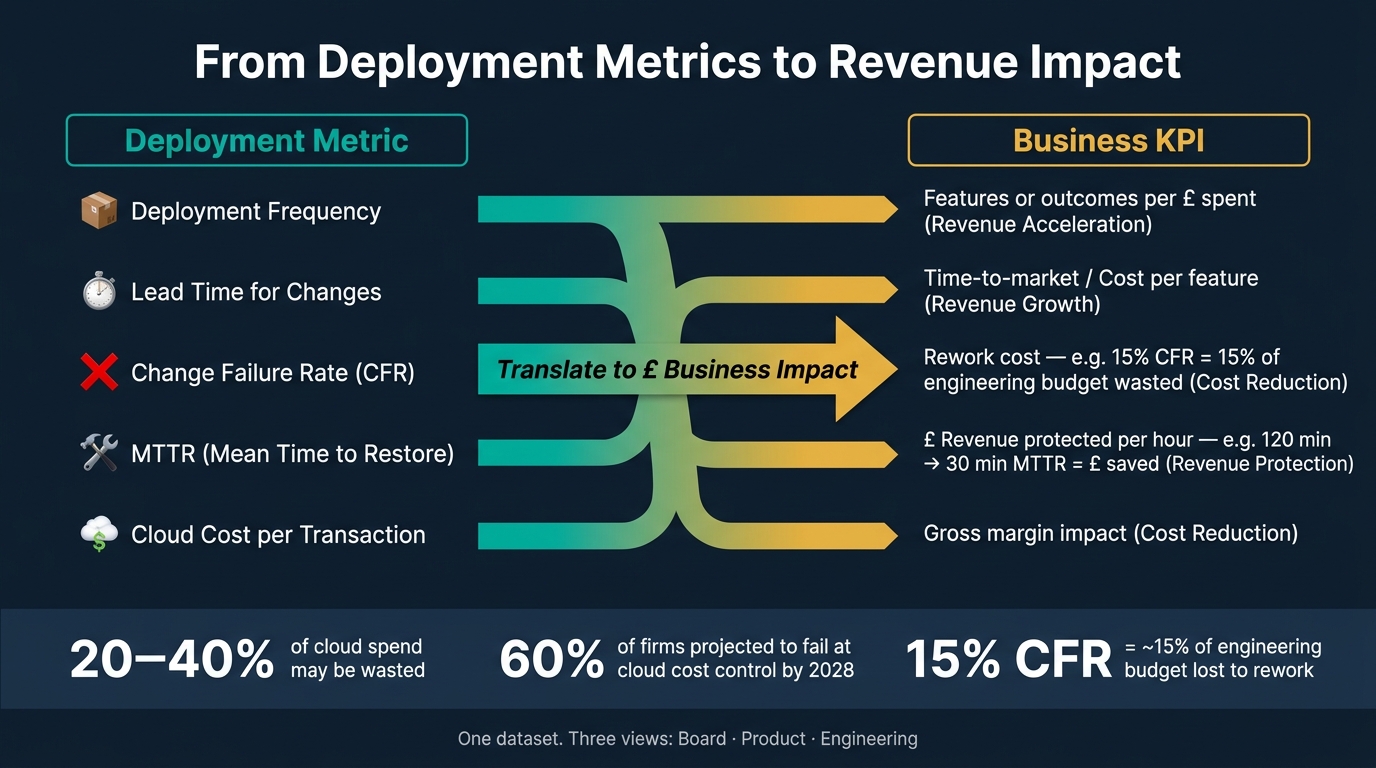 {DORA Metrics to Revenue KPIs: The Business Translation Framework}
:::
{DORA Metrics to Revenue KPIs: The Business Translation Framework}
:::
Beyond the DORA metrics: Measuring engineering excellence - Thoughtworks Technology Podcast
Need help optimizing your cloud costs?
Get expert advice on how to reduce your cloud expenses without sacrificing performance.
The problem: deployment metrics are often isolated from financial results
Most teams track delivery in one place and revenue in another. That split makes it hard to show commercial impact. Without shared attribution, teams end up improving activity, not value.
Isolated DevOps dashboards show activity without proof of value
A team can ship more releases in a sprint and still have no clear sense of whether any of them changed the business. Deployment frequency, by itself, is a weak metric. Split one feature into several deploys, and the number goes up even if the actual value does not [3].
This becomes much clearer when delivery metrics are tied to unit economics. Then the conversation shifts from how much shipped to what it cost and what it produced.
| DORA Metric | Commercial View |
|---|---|
| Lead Time | Cost-per-feature (WIP × fully loaded hourly rate) [3] |
| Deployment Frequency | Features delivered per £ spent [3] |
| Change Failure Rate | Budget spent on fixing, not building [4] |
| MTTR | Revenue protected or lost per hour of downtime [4] |
Without that commercial lens, even strong delivery performance can seem irrelevant to a CFO.
Missing tagging and attribution block useful analysis
Even when teams want attribution, the data is usually scattered. If CI/CD pipelines, observability tools, and cloud billing platforms do not use the same tags for product, feature, and service, there is no dependable way to tell whether a release to checkout or onboarding improved conversion [2].
There is another problem too. Teams often undercount Change Failure Rate by logging only P1 incidents. Lower-severity issues may not trigger the same alarm, but they still take up engineering time and add to rework costs. A 15% CFR, measured properly, means 15% of the engineering budget is going into rework instead of new builds [4]. That number rarely makes it into board reporting.
Cloud cost growth can cancel out delivery gains
Faster delivery does not, on its own, protect margin. If cloud spend climbs at the same time, much of the gain can disappear. DevOps teams often waste 20–40% of cloud spend on decisions that are not reviewed until the invoice lands [5]. Extra test environments, overprovisioned services left running, and poor scaling during deployment all chip away at returns. Through 2028, 60% of organisations are projected to fail at controlling cloud spending without automated governance [5].
So you end up with one dashboard showing better delivery, another showing rising infrastructure cost, and no joined-up view of margin impact.
The fix is shared tagging, attribution, and revenue-linked dashboards.
The solution: map deployment metrics to revenue KPIs with shared data
If shared attribution is the starting point, the next move is simple: give each deployment metric a business owner and tie it to an outcome. Each one should connect to a finance-owned KPI, such as revenue growth, revenue protection, cost reduction or risk reduction. That gives teams a clearer line from software delivery to decisions around pricing, conversion, margin, downtime and retention.
Build metric pairs that link delivery to business KPIs
The most practical way to close the gap between engineering and finance is to pair each DORA metric with a financial result. That turns delivery data into something the business can act on.
Lead time links to time-to-market for seasonal launches. Change Failure Rate links to rework cost. For example, a team with an 18% CFR across 40 deployments costs roughly £3,860 per quarter in rework at a £46 loaded rate [3]. MTTR links to revenue at risk for each hour of downtime [4].
| Deployment Metric | Business KPI | Data Sources | UK Use Case |
|---|---|---|---|
| Deployment Frequency | Revenue acceleration | CI/CD pipeline + billing data | Faster rollout of new SaaS billing tiers |
| Lead Time for Changes | Time-to-market | Jira/GitHub + product analytics | Launching a seasonal e-commerce campaign |
| Change Failure Rate | Rework cost / refunds | Incident logs + finance/ERP | Reducing failed checkout sessions in retail |
| MTTR | Revenue protection | Observability tools + revenue logs | Minimising downtime for a UK banking app |
| Cost per Transaction | Gross margin | Cloud billing + transaction logs | Optimising margins for a high-volume fintech |
Use tagging, value streams, and unit cost metrics
These metric pairs only work if the source data is tied together. In practice, that means using the same identifiers across your CI/CD pipeline, cloud billing, product analytics and finance systems. Service-level tags matter here, as do business dimensions like customer segment, region and plan tier.
Value stream mapping pushes this one step further. Each service should connect to a stage in the customer journey, such as signup, checkout, activation or renewal, and each stage should be weighted by revenue impact. That way, teams can tell the difference between a problem that hits the top line and one that’s mostly internal noise.
A latency spike on your pricing API hits conversion directly; a slowdown in an internal reporting tool does not.
Unit cost metrics, like cost per transaction, help even more. They give finance a figure it can compare with gross margin, without dragging everyone into low-level infrastructure detail.
That shared model can then support separate views for finance, product and engineering.
Build dashboards for executives and delivery teams
Once the data is joined, show it in three views built from the same source.
- An executive summary led by business KPIs and SLO status
- A product operations layer tracking funnel stages and customer cohorts
- An engineering diagnostic view with traces, logs and deployment markers
The key point is that engineering metrics sit underneath these views as drivers of the business KPIs above.
All three should pull from the same warehouse or lakehouse, where telemetry, billing records and CRM data are joined using shared identifiers. Review the model monthly and quarterly to test assumptions and keep governance tight.
How to implement this model in a UK organisation
Start with revenue hypotheses and shared KPI definitions
Start by agreeing a small set of KPI pairs to track. Then define the Finance-owned outcome tied to each one. Once the KPI map is in place, move from definitions to instrumentation.
The big move here is simple: write the hypothesis down first. Tie each delivery metric to a business outcome before any work begins. If lead time drops, what should happen to cost per feature or time to revenue? Putting those links on paper early gives the senior engineering leader a much stronger way to report ROI to Finance [3][1].
Those mappings should then shape the dashboard design. Lead time maps to cost per feature, deployment frequency to cost per deployment, change failure rate to rework costs, and MTTR to incident cost per hour [3]. When those links are clear, one dataset can show delivery health for engineering teams and financial impact for senior leaders.
Instrument pipelines, analytics, and cloud cost data together
Next, make the data traceable from end to end. The aim is to make DORA metrics, cloud billing, and customer revenue data queryable from one warehouse or lakehouse, so the same dataset can support both delivery analysis and financial analysis [3].
Three steps usually make this work:
- Link ticket IDs to deployments. Use ticket IDs in branch names - for example,
feature/PROJ-1180- so code commits and deployment events point back to the same initiative. - Tag resources at creation. Assign a unique Deployment ID to each provisioned resource, then query billing data at daily granularity to calculate cost per deployment.
- Add cost checks before deployment. Gate expensive infrastructure changes in the CI/CD pipeline using Terraform plan JSON, so they are flagged before provisioning [3][5].
Review monthly and quarterly, and enforce governance
Once the data is linked, review it on a fixed cadence. Monthly operational reviews should cover cost per deployment and unit economics for engineering leads and product managers. Quarterly business reviews should cover TCO trends, incident cost avoidance, and ROI for the CTO, CFO, and board [2][3]. In most cases, the senior engineering leader owns the ROI report, while Finance partners on the cost side [1].
Governance is usually straightforward: set rules early, detect drift after releases, and fix issues when they show up [5]. Non-production environments often run 168 hours a week but are actively used for only 40-50 hours, so idle spend can pile up fast if no one clears it down on a regular basis [5].
Conclusion: measure deployments by revenue impact, not delivery activity alone
Deployment frequency and lead time show how fast software moves through delivery. But on their own, they do not show finance leaders whether that speed is paying off.
Every engineering metric needs to connect to one of four business outcomes: revenue growth, revenue protection, cost reduction, or risk reduction. That is why the model above matters. The issue is not poor data quality. It is KPI alignment. When engineering and finance apply tagging at the source and review the same dashboard together, the numbers start to tell one clear story.
Key takeaways for leadership and engineering
In practice, the steps are pretty simple. Pair every deployment metric with a business outcome: change failure rate with rework cost, MTTR with revenue protection, and deployment frequency with cost throughput. Align data by product or value stream with branch-name conventions and mandatory tags. Track cloud cost alongside delivery performance, not in a separate view. And review outcomes on a set cadence, so engineering, product, and finance are all working from the same signals.
The organisations that get this right are the ones where engineering leaders and finance teams share the same definition of success and measure it together. More than any dashboard or pipeline tweak, that is what turns deployment data into a business case people can trust.
Hokstad Consulting helps teams align DevOps performance with cloud cost control and revenue reporting.
FAQs
How do we link DORA metrics to revenue?
Link DORA metrics to revenue by turning technical flow data into financial outcomes like cost, risk, and growth. Put a money figure on time saved by engineers, shorter incident duration, and a lower cost per feature or deployment.
Faster deployment frequency and shorter lead times also have a direct business effect. Teams can test ideas sooner, learn from results faster, and ship revenue-driving features without the usual delay. That means less waiting, more delivery, and a tighter link between engineering work and commercial results.
Hokstad Consulting helps turn these gains into measurable financial outcomes through optimised cloud infrastructure and better engineering workflows.
Which tags and IDs should we standardise first?
Start with tags and IDs that support steady cost allocation and clear reporting detail. Hokstad Consulting recommends putting tagging coverage rate first, because it lays the groundwork for sound performance and cost tracking.
Next, standardise shared identifiers such as feature_id and project_id. These make it easier to connect engineering data with cost data across separate systems. That way, you can link deployment metrics to unit economics and measure financial impact with more accuracy.
What should we show the board each quarter?
Show board metrics in business terms, not just as DORA scores on a slide.
The key is to turn delivery and ops data into numbers the board already cares about: revenue, margin, risk, cost-to-serve, and total cost of ownership. That means showing the trend over the last 6–12 months, what changed, what it means for the business, and the £ value attached to it.
For example, don’t present MTTR as a standalone engineering figure. Present it as revenue at risk during service disruption, plus the incident cost avoided as recovery times come down. In the same way, deployment frequency should show up as faster revenue capture, shorter time to launch, or a better ability to respond when the market shifts.
Focus the pack on three areas:
- Total cost of ownership: how platform, tooling, support effort, rework, and manual process costs are moving over time
- Incident cost avoidance: how changes in availability, MTTR, and failed changes affect lost sales, service credits, support load, and staff time
- Compliance acceleration: how delivery, audit, and control evidence are moving faster, with less manual work and lower delay cost
A simple board-ready view might link each metric like this:
| Metric | 6–12 month trend | Business lens | Typical £ expression |
|---|---|---|---|
| MTTR | Down from prior period | Revenue at risk, service cost, operational risk | £ lost or protected per incident |
| Deployment frequency | Up over time | Faster revenue capture, faster market response | £ gained from earlier launch or change |
| Change failure rate | Down over time | Lower waste, fewer service hits, lower support cost | £ avoided in rework, credits, and lost sales |
| Lead time for changes | Down over time | Quicker delivery, faster compliance response | £ gained from earlier benefit realisation |
| Availability / incident volume | Stable or improving | Margin protection, lower cost-to-serve | £ protected revenue and support savings |
| Audit / control evidence cycle time | Down over time | Faster compliance sign-off, less manual effort | £ saved in labour and delay cost |
Keep the wording plain. Boards don’t need raw operational telemetry. They need to know what moved, why it matters, and what it’s worth in £.