
Cloud costs are skyrocketing, with UK businesses spending £18.9 billion on public cloud services in 2024, rising to £22.8 billion in 2025. Yet, 89% of organisations overspend, and 32% of budgets are wasted due to inefficiencies like over-provisioning and idle resources. Real-time cost analysis can save you 20–30% by identifying waste, reducing budget overruns, and optimising resource use.
Here’s a quick breakdown of how to get started:
- Automate Data Collection: Use tools like AWS CUR, Azure Cost Management, or Google Cloud Billing Export to track costs in real time.
- Normalise and Consolidate Data: Standardise formats, currencies, and metrics across platforms for accurate comparisons.
- Build Real-Time Dashboards: Monitor key metrics (e.g., daily spend, forecasted costs) and segment data by departments or projects.
- Analyse Usage Trends: Spot inefficiencies like idle resources and calculate cost per transaction to ensure spending aligns with growth.
- Set Up Alerts and Automations: Configure alerts for budget thresholds and automate cost-saving actions like shutting down unused instances.
Real-time monitoring helps businesses avoid waste, improve budget control, and uncover savings opportunities. For example, a Manchester SaaS firm saved £40,000 annually, while another company reduced costs by 25–35% through continuous monitoring.
::: @figure 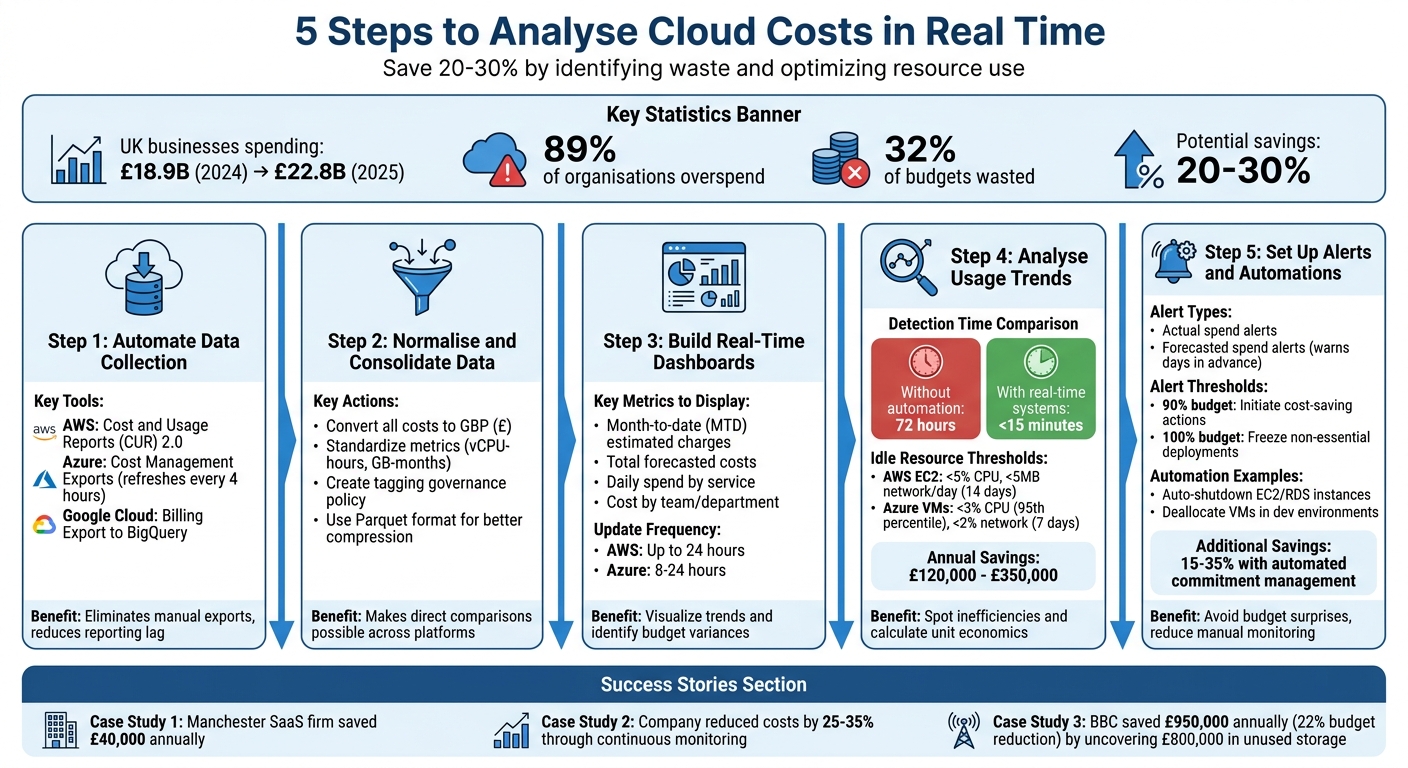 {5 Steps to Analyze Cloud Costs in Real Time - Complete Process Guide}
:::
{5 Steps to Analyze Cloud Costs in Real Time - Complete Process Guide}
:::
How to Track Cloud Costs in Real-Time Instead of Waiting Days
Need help optimizing your cloud costs?
Get expert advice on how to reduce your cloud expenses without sacrificing performance.
Step 1: Set Up Automated Data Collection
Automating data collection eliminates the need for manual exports and reduces the lag in reporting, helping you catch overspending as it happens. Most major cloud providers offer built-in tools to export detailed billing data, though the setup process differs for each platform.
Using these native tools ensures accurate and timely data collection.
Select Native Tools
AWS: The Cost and Usage Reports (CUR) 2.0 is the most detailed option available. It sends data to an Amazon S3 bucket and updates at least once daily, with the potential for up to three updates per day [6]. While the service itself is free, you'll need to account for standard S3 storage costs [4].
Azure: Configure Cost Management Exports to generate CSV files in an Azure Storage account. This feature is free, with costs limited to the blob storage used [2]. Cost data refreshes every four hours, though frequent API calls may lead to throttling [5]. Azure also supports the FinOps Open Cost and Usage Specification (FOCUS), which combines actual and amortised costs to streamline data processing [7].
Google Cloud: Enable Cloud Billing Export to BigQuery to stream usage, cost estimates, and pricing data to BigQuery throughout the day [1]. Exporting billing data to BigQuery is free, though you'll incur storage and query costs [1]. Google's documentation advises:
To access a more comprehensive set of Google Cloud billing data for your analysis needs, we recommend that you enable Cloud Billing data export to BigQuery at the same time that you create a Cloud Billing account.[1]
Once you've selected the appropriate tool, configure the export settings to ensure the data meets your needs.
Enable Timely Exports
AWS: Set the
Time granularity
to Hourly and enableInclude resource IDs
to track individual resources. Keep in mind that the first reports may take up to 24 hours to appear [3][6].Azure: Decide between
Actual cost
(the billed amount) andAmortised cost
(which spreads one-time purchases like Reserved Instances over their term) [2]. For UK-specific analysis, set exports to GBP (£) to avoid manual currency conversions, as AWS bills in USD. Enable file partitioning to break large datasets into smaller chunks under 1GB for easier processing [7]. Use storage lifecycle management to delete export files after 90 days, cutting down on storage costs [2].Google Cloud: Use the
Standard usage export
for general trends and theDetailed usage export
for resource-specific troubleshooting. The latter includes data for services like Compute Engine, GKE, Cloud Run, and Cloud Run functions [1]. This dual-layer approach can help optimise BigQuery query costs by limiting unnecessary details when monitoring overall spending.
Step 2: Normalise and Consolidate Data
Once you've automated data collection, the next step is to standardise everything - formats, currencies, structures - to make direct comparisons possible. Cloud providers often use different naming conventions and metrics, so getting everything on the same page is critical. This process sets the stage for building real-time dashboards in the following step.
Standardise Metrics and Currencies
Start by converting all costs into GBP (£). For instance, AWS bills in USD by default, so you'll need to account for currency conversion to ensure consistency. Beyond just currencies, align metrics like vCPU-hours and GB-months across providers such as AWS EC2, Azure Virtual Machines, and Google Compute Engine. This ensures you're comparing costs fairly and accurately.
Tagging is another area where consistency is key. Create a tagging governance policy early on. This should include rules for tag keys, character limits, and case sensitivity to ensure uniform tagging across platforms. Without this, managing and comparing data becomes unnecessarily complicated.
Consolidate Multi-Account Data
If you're working with multiple accounts, you'll need to consolidate that data effectively. Choose an allocation method that fits your needs:
- Account-based allocation: Ideal for independent teams managing their own resources.
- Tagging-based allocation: Best for detailed tracking, as long as tagging is strictly governed.
- Usage-based allocation: Useful for distributing costs proportionally based on resource usage.
For AWS multi-account setups, store data in S3 using Parquet instead of CSV. Parquet offers better compression and speeds up Athena queries, making it a more efficient choice [8]. On Google Cloud, consider creating BigQuery views to standardise data structures. This approach also shields your reports from potential schema changes by the provider [1]. Remember, while loading data into BigQuery datasets is free, costs will apply for streaming, storing, and querying data [1].
Step 3: Build Real-Time Dashboards
With your data now organised and consolidated (as outlined in Step 2), real-time dashboards transform these figures into actionable insights. These dashboards help visualise trends and identify budget variances, provided they focus on the right metrics and segment the data in a way that mirrors your business structure.
Display Key Metrics
Start with the basics: month-to-date (MTD) estimated charges, comparisons to the same period last month, and total forecasted costs for the current month [9]. These metrics are essential for identifying whether you're staying on budget or overspending. Tools like AWS Cost Explorer, Azure Cost Management + Billing, and GCP Billing Reports make it easier to configure dashboards for such visualisations [10][12].
To catch cost spikes early, set your charts to daily granularity rather than monthly [12][13]. Keep in mind that AWS Cost Explorer data may take up to 24 hours to update after it's enabled [9][13], while Azure Cost Management generally refreshes every 8 to 24 hours [9][12]. For month-over-month comparisons, use amortised costs instead of actual costs - this approach smooths out reservation costs, offering a more accurate picture of your spending [12].
Once you've established these core metrics, you can dive deeper by segmenting your data.
Segment Data for Insights
Breaking costs down by business dimensions - such as department, project, environment, or application - takes your dashboard to the next level. To do this effectively, you need a well-defined tagging system (e.g., CostCenter, Owner, Environment, Application) to allocate expenses to the appropriate teams or initiatives [12].
Add views like Daily Spend by Service
or Cost by Team
to your dashboard for quick reference [12]. In Azure, you can enable tag inheritance, which ensures that individual resources automatically adopt the tags of their parent resource groups in cost reports [12]. For broader reporting needs, such as executive summaries or multi-cloud environments, consider integrating your cloud data with tools like Power BI or Amazon QuickSight [11][12]. You can also automate the delivery of dashboard PDFs via email to stakeholders on a daily, weekly, or monthly basis - this ensures everyone stays informed without requiring manual updates [10].
Step 4: Analyse Usage Trends and Correlations
Real-time analysis is a game-changer for cutting costs quickly. With the help of real-time dashboards, you can dig deeper into your data to spot inefficiencies and uncover opportunities to save money. Here's an eye-opener: the average time to detect a cloud cost anomaly without automation is 72 hours. With real-time systems, you can slash that down to under 15 minutes [14]. That difference could save your organisation thousands of pounds in unexpected expenses.
Identify Idle Resources
One of the easiest ways to cut costs is by identifying idle resources - like unused instances, disks, or databases. Set clear thresholds to flag these underperforming resources. For example:
- AWS EC2: Look for instances with CPU usage below 5% and network activity under 5 MB per day over a 14-day period.
- Azure VMs: Flag instances where the 95th percentile CPU usage is less than 3%, with network usage under 2% over seven days.
- Storage: Spot EBS volumes with fewer than one operation per day over 14 days or those unattached for 32 days [14].
These thresholds help you focus on genuinely wasteful resources. Once identified, take a snapshot of any critical data, then either delete or stop the resource. Organisations using real-time detection save between £120,000 and £350,000 annually in unplanned costs [14].
After addressing idle resources, take the next step by connecting these findings to the broader business impact through unit economics.
Calculate Unit Economics
Unit economics lets you tie cloud costs directly to specific workloads or transactions, helping you understand the value you're getting for your spend. For instance, calculate the cost per API request, user session, or batch job. This approach reveals whether your cloud expenses are scaling in line with your business growth. If the cost per transaction increases while revenue stays flat, it's a red flag to tackle inefficiencies immediately.
To catch gradual increases in costs - known as cost drift
- monitor the ratio between short-term (3-day) and long-term (14-day) exponential moving averages. When this ratio exceeds 1.15, it signals a significant upward drift [14]. This method is particularly useful for spotting slow, steady cost rises that might slip past basic spike detection systems. As the HostingX FinOps Team wisely notes:
The difference between a £50 incident and a £50,000 incident is detection latency - not prevention[14].
Step 5: Set Up Alerts and Automations
Once you’ve got a good handle on real-time usage insights, it’s time to take action. By setting up alerts and leveraging automation, you can avoid budget surprises while reducing the need for constant monitoring.
Configure Budget Alerts
Budget alerts are your early warning system. Set them up to monitor both actual spend and forecasted spend. Forecast-based alerts, in particular, are a game changer - they can warn you days in advance if you’re on track to exceed your budget, giving you time to adjust resources before it’s too late[15][16][17][18].
You can customise these alerts to fit your needs. For example, budgets can be scoped at different levels, such as:
- Billing account
- Specific subscriptions
- Resource groups
- Tags (e.g.,
Environment=Development)
This level of detail ensures you can pinpoint issues in specific areas before they spiral out of control. As Nawaz Dhandala from OneUptime aptly explains:
Bill shock is when you open your Azure invoice and discover it is three times what you expected.[17]
Platforms like AWS Budgets and Azure Cost Management provide these alerting tools at no extra cost[17]. To stay on top of spending, consider setting up measures to kick in at key milestones - for instance, initiating cost-saving actions when you hit 90% of your budget and freezing non-essential deployments once you reach 100%[17].
Automate Optimisations
While alerts are crucial, they’re only half the story. Automation ensures you can act on those alerts without delay. For example:
- AWS: Use Budget Actions to automatically enforce IAM policies or shut down specific EC2 and RDS instances when spending exceeds thresholds[15].
- Azure: Link budget alerts to Azure Functions or Logic Apps to deallocate virtual machines in development environments as soon as limits are reached[21].
Another powerful tool is machine-learning-based anomaly detection. This can identify sudden spikes - like runaway Lambda functions - within hours, even if you’re still under your overall budget[19]. Unlike standard alerts, which rely on cumulative thresholds, anomaly detection focuses on unusual patterns as they happen. To ensure these alerts don’t get lost, route them directly to the relevant team via Slack or Teams, using resource tags for precision[19].
For organisations with large cloud expenditures, automated commitment management can further enhance savings. By continuously rebalancing Reserved Instances and Savings Plans, companies can achieve 15–35% higher savings compared to manual management[20]. If you’re looking to take things up a notch, external experts can help fine-tune these processes.
Work with Hokstad Consulting
If you’re serious about cutting costs, partnering with specialists can make a big difference. Hokstad Consulting offers tailored cloud cost solutions that can reduce expenses by as much as 30–50%. Their approach combines automated optimisation, advanced monitoring, and smart resource management. Plus, they offer a No Savings, No Fee
model - meaning you only pay if they deliver measurable savings.
Conclusion
Real-time cloud cost analysis reshapes how organisations manage their cloud expenses, replacing unexpected billing shocks with proactive control. By continuously collecting data, normalising it, and providing real-time alerts, this approach helps to identify and eliminate inefficiencies before they spiral out of control.
The potential savings are impressive. For example, real-time monitoring and optimisation efforts can cut costs by 20–30% [22]. A practical case: between January and June 2023, the BBC used Azure Cost Management to consolidate multiple accounts. Through data normalisation and alert systems led by FinOps Lead Emma Walsh, they uncovered £800,000 in unused storage, achieving a 22% reduction in their budget and saving £950,000 annually [23].
However, achieving these results is only part of the journey. Sustaining optimisation requires ongoing strategies, quarterly reviews, and clearly defined roles and workflows. Regular performance reporting is also vital to demonstrate value to stakeholders. For many organisations, the complexity of multi-cloud setups and the rapid pace of technological change make it difficult to maintain this momentum without expert input.
For those looking to go beyond basic cost analysis, Hokstad Consulting offers tailored cloud cost engineering services. Their expertise spans DevOps transformation, strategic migrations, and custom automation, with the promise of reducing expenses by 30–50%. With their No Savings, No Fee
model, you only pay when tangible results are achieved. Whether managing public, private, or hybrid cloud environments, their guidance can help your organisation maintain continuous improvement and scale effectively as your needs evolve.
FAQs
How close to ‘real time’ can cloud cost data really be?
Cloud cost data can be tracked in real time, but how quickly this happens depends on the tools and processes in place. With effective monitoring systems and alerts, organisations can spot cost anomalies within 15 minutes to a few hours. This allows for swift action to address potential issues. On the other hand, relying solely on monthly or weekly reports can lead to delays of days or even weeks, significantly increasing the chance of overspending.
What tags should we standardise first for accurate cost allocation?
The most crucial tags to focus on for precise cost allocation are those that define resource ownership, environment, and project or cost centre. Essential tags include owner, environment, and cost centre or project. By standardising these tags, you ensure resources are categorised consistently, simplifying the process of tracking and assigning expenses to the appropriate teams, projects, or departments. This consistency plays a key role in managing cloud costs effectively.
Which automations are safest to start with to avoid breaking production?
When diving into automation, it's best to start with tools that simply monitor and notify you about spending anomalies, rather than making changes or shutting down resources. A great example is real-time cost alerts - these send notifications when your spending approaches set limits. This way, you can manually review the situation before taking any action, minimising the chance of disrupting critical operations. Automations that take more direct actions, like auto-shutdowns, should only be implemented after careful testing and gradual introduction.