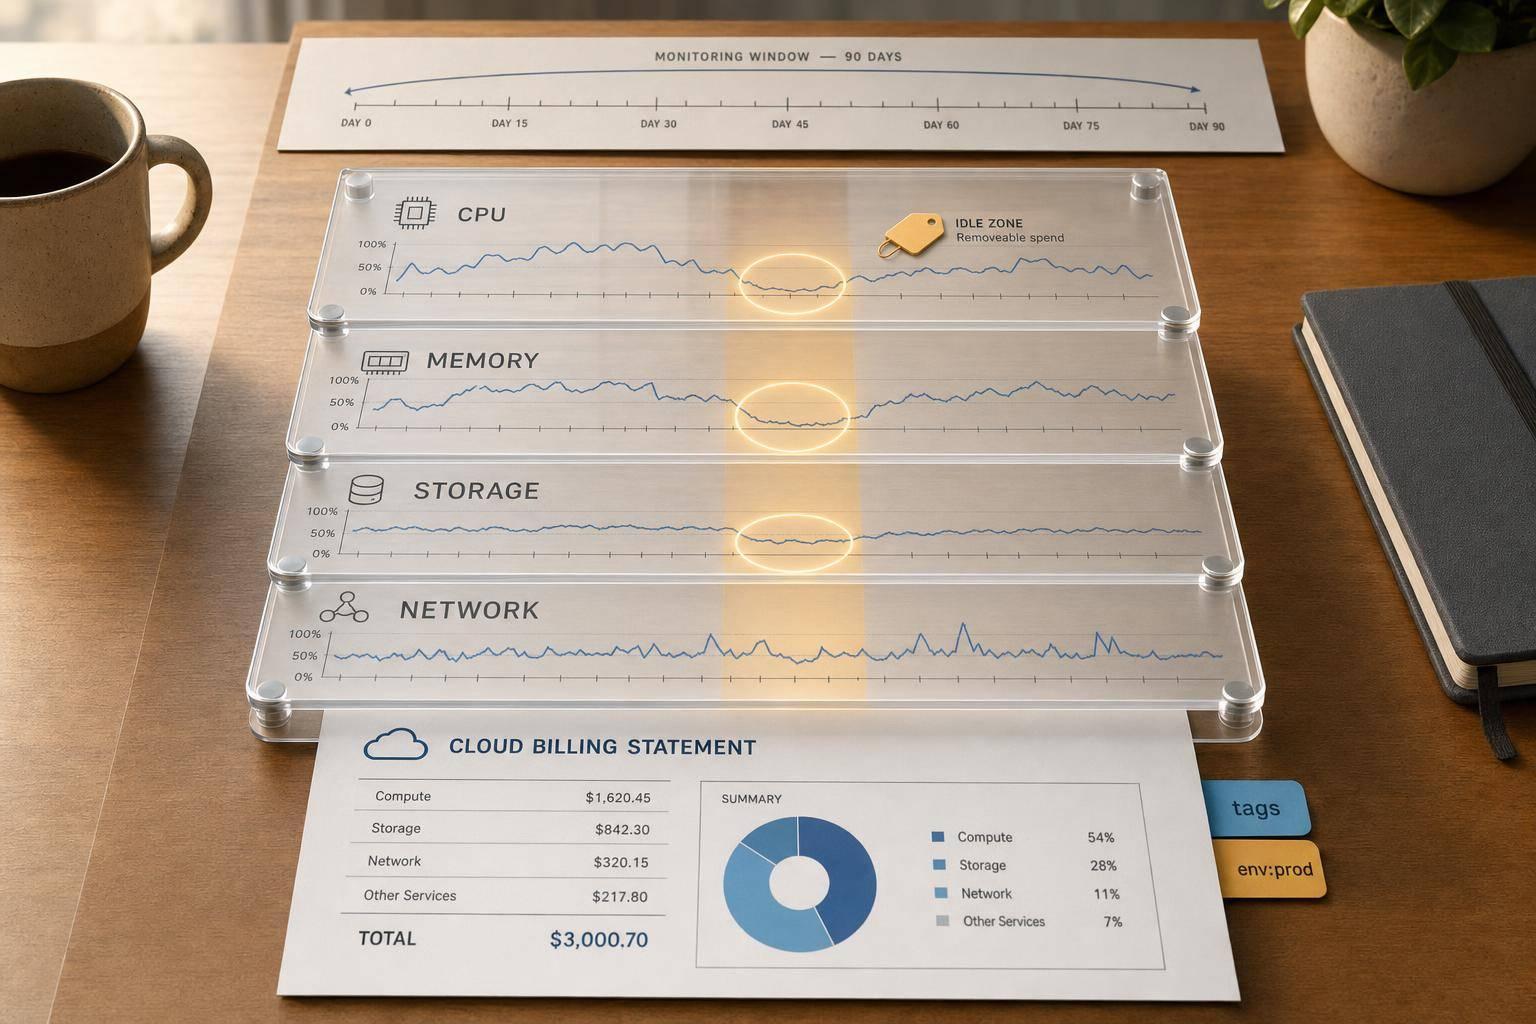
If I want to cut cloud waste without hurting performance, I start with idle and underused resources. In most cases, the pattern is simple: if compute sits below 20% for days, or below 5% for two weeks, I’m likely paying for capacity I do not need. And if usage stays above 80%–90%, I treat that as a warning sign for performance risk.
Here’s the article in plain terms:
- I set the scope first by team, project, environment, and resource type
- I use a 60–90 day look-back so short spikes do not skew the picture
- I bring together monitoring, billing, and inventory data in one view
- I check CPU, memory, storage, database, and network usage together, not in isolation
- I use P95/P99, not just averages, because averages can hide short peaks
- I separate idle, underused, balanced, overused, and spiky resources
- I turn that into actions: delete, downsize, tune autoscaling, or scale up
- I keep the process on a fixed weekly and monthly review cycle
A few numbers matter straight away:
- 60%–80% sustained compute use is often a good target range
- <20% CPU over 7 days can point to underuse
- <5% CPU over 14 days can point to idle capacity
- <10% memory over 14 days can also point to idle compute
- 0 database connections for 7 days is a strong idle signal
- Idle resources can often return up to 90% of their cost if removed
- Rightsizing underused resources can often return about 50%
| Area | What I check | What it tells me |
|---|---|---|
| Compute | CPU, memory, disk I/O, network | Whether instances or pods are too large or too busy |
| Storage | Used space, IOPS, throughput, attachment status | Whether volumes are oversized or sitting unused |
| Databases | CPU, connections, IOPS, storage growth | Whether database capacity matches demand |
| Network | Egress and bandwidth use | Whether network-heavy services are sized well |
| Data quality | Tags, memory metrics, billing match, inventory | Whether I can trust the report |
In short: I compare what I bought with what I used, then I sort each resource into a clear action list backed by usage data and spend.
::: @figure 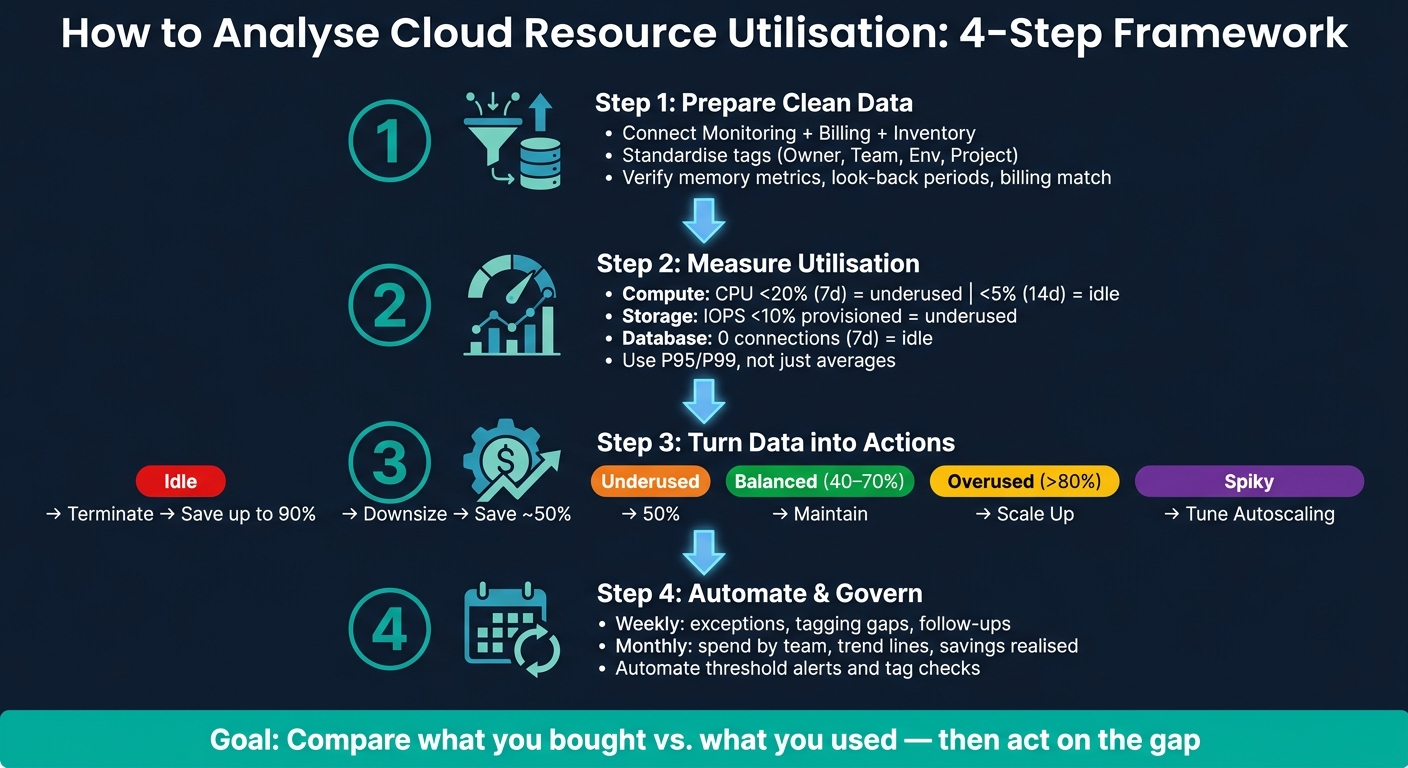 {Cloud Resource Utilisation Analysis: 4-Step Process}
:::
{Cloud Resource Utilisation Analysis: 4-Step Process}
:::
How Can You Track Cloud Resource Usage Effectively? - Emerging Tech Insider
Need help optimizing your cloud costs?
Get expert advice on how to reduce your cloud expenses without sacrificing performance.
Step 1: Prepare Clean Data from Monitoring, Billing and Inventory Sources
Accurate utilisation analysis depends on three things lining up in one view: monitoring metrics, billing records, and a live resource inventory. Each one tells a different part of the story.
Monitoring shows how a resource is behaving. Billing shows what you’re paying for. Inventory shows what actually exists across your cloud estate. Bring those three inputs together first, or the numbers can send you in the wrong direction.
Connect Monitoring and Billing Data Across Your Cloud Environment
Pull data from the sources below:
| Cloud Provider | Core Monitoring Tool | Billing Data Source |
|---|---|---|
| AWS | CloudWatch | Cost and Usage Report (CUR) 2.0 |
| Azure | Azure Monitor | Cost Management Exports |
| Google Cloud | Cloud Monitoring | Cloud Billing Export to BigQuery |
| Kubernetes | Prometheus / Grafana | Underlying cloud billing export for the cluster and nodes |
Before you measure utilisation, make sure agents are collecting memory metrics. If memory data is missing, you’re only seeing part of the picture, and that can lead to bad calls on resizing or removal.
Once the data sits in one reporting view, use tags to connect usage and spend to the right owner.
Standardise Tags and Labels for Ownership and Cost Allocation
Tags tie a technical resource to a team, a service, and a budget. Without them, a list of underused instances doesn’t tell you much. You can’t see who owns them, whether they’re production or development, or whether it’s safe to resize or delete them.
Apply tags for:
- Ownership:
Owner,Team - Business context:
Project,CostCentre - Environment:
Envsuch asProdorDev - Automation:
Schedule,OptOut
This makes cost allocation possible and helps later when you prioritise rightsizing or clean-up work. Without tagging, you can’t act with much confidence.
After tagging, check whether the data is clean enough to support decisions.
Check Data Quality Before Drawing Conclusions
Don’t measure anything until memory, tags, and billing data line up. Run checks across:
- Memory metrics - confirm agents are collecting them
- Look-back periods - align across monitoring and billing sources
- Billing reconciliation - match metered usage to invoiced data
- Unattached resources - identify orphaned or idle assets in the inventory
- Tag coverage - verify resources can be attributed to an owner and service
Fix the obvious gaps first: untagged resources, missing memory metrics, and look-back periods that don’t match.
With clean inputs in place, you can measure utilisation by resource type.
Step 2: Measure Utilisation by Resource Type and Platform
Once your data is clean and tagged, the next job is to measure usage by resource type and platform. The goal is simple: find out which resources are underused, over-sized, or running too close to the edge based on actual metrics, not gut feel.
Analyse Compute, Storage, Database and Network Usage
Each resource type behaves differently, so you need to look at different signals for each one.
For compute such as virtual machines and containers, track CPU, memory, network throughput, and disk I/O together. Looking at CPU on its own can give you the wrong picture. A workload might show low CPU use while memory pressure or disk I/O is doing the damage.
For storage, monitor IOPS used versus provisioned, throughput, and whether volumes are attached at all. In AWS, pay close attention to VolumeQueueLength and BurstBalance on EBS volumes. When burst credits run low, latency goes up [2].
For databases, watch active connection counts, CPU, IOPS, and storage used versus allocated. RDS instances with fewer than one active connection are usually idle. Big swings across these metrics often point to a workload that fits serverless or on-demand capacity better [3].
Averages help, but they don't tell the whole story. Pair them with P95/P99 because averages can smooth over short spikes that still hurt performance. Here are some practical thresholds to use [3].
| Resource Type | Metric | Under-Utilised Threshold | Idle Threshold |
|---|---|---|---|
| Compute (VM/Pod) | CPU Utilisation | < 20% avg over 7 days | < 5% avg over 14 days |
| Compute (VM/Pod) | Memory Utilisation | < 30% avg over 7 days | < 10% avg over 14 days |
| Storage (Block) | IOPS Used | < 10% of provisioned | < 1% for 30 days |
| Database (RDS) | Active Connections | < 5 active connections | 0 connections for 7 days |
| Database (RDS) | CPU Utilisation | < 10% avg over 7 days | < 2% avg over 14 days |
| Network | Bandwidth | Low usage vs. capacity | < 5 MB/day (EC2) |
Use Cloud-Native Tools to Inspect AWS, Azure, Google Cloud and Kubernetes
Stick to native metrics, but use the same definitions across AWS, Azure, and Google Cloud so you're comparing like with like.
In AWS, use CloudWatch and the CloudWatch Agent for memory. In Azure, use Azure Monitor with the Azure Monitor Agent to collect memory and disk metrics. In Google Cloud, use the Ops Agent for memory.
For Kubernetes, compare pod requests with actual usage. That's where wasted reserved capacity tends to hide. If pod requests sit far above what the workload uses, you're paying for space that never gets touched [2] [1]. A good way to check this is to run the Vertical Pod Autoscaler (VPA) in recommendation mode for at least 24 hours. That gives you data-based target values for pod requests [4], which you can then compare with your current settings.
Account for Seasonality, Peaks and Autoscaling Behaviour
Usage patterns matter just as much as raw numbers. Compare business-hour demand with overnight and weekend demand so you can tell the difference between constant underuse and a setup that just has normal daily peaks [1].
To sort stable workloads from bursty ones, calculate the coefficient of variation, which is the standard deviation divided by the average. A CV below 0.2 points to stable low usage. Higher values suggest a bursty workload that may need autoscaling rather than a smaller instance size [1].
Autoscaling can muddy the picture too, so check scaling logs alongside the metrics. Otherwise, a system can look busy or quiet for the wrong reason.
Use these patterns to connect utilisation with spend and decide what to tackle first in the next step.
Step 3: Turn Utilisation Data into Cost and Optimisation Actions
Map Utilisation to Spend and Business Value
Bring CPU, memory, IOPS, connections and bandwidth metrics together with billing data to work out the daily cost per resource. From there, you can estimate wasted spend and the monthly savings available across your estate. That cost view makes it much easier to rank which fixes deserve attention first.
For databases, use a weighted score that blends CPU, connections, IOPS and storage into a single per-instance metric [1].
Prioritise Rightsizing, Scaling and Clean-Up Actions
Once you have those cost signals, sort each resource into a clear action path.
Idle resources should go first. They drain budget without giving anything back. Consistently underused resources are good candidates for downsizing. When you resize, use P95 demand rather than averages [1]. Average usage can look calm while short peaks tell a very different story.
If demand swings up and down or comes in bursts, tune or add autoscaling instead of forcing the workload onto a smaller instance. On the other side, if CPU or memory stays above 80% for long stretches, you need to scale up, scale out, or tighten the code before performance starts to slip [1].
Present Findings in a Decision-Ready Comparison Table
Group each resource by utilisation status, show the likely cost effect, and pair it with a plain next step. Savings estimates should use multipliers that match what teams often see in practice: about 90% of resource cost can be recovered by terminating idle resources, and about 50% can be recovered by rightsizing underused ones [1].
| Utilisation Status | Typical Signals | Estimated Savings or Risk | Recommended Action |
|---|---|---|---|
| Idle | CPU <5%, network <5 MB/day for 14 days | High - up to 90% of resource cost | Terminate or decommission immediately |
| Under-utilised | CPU and memory <20% for 7+ days | Moderate - approx. 50% of resource cost | Downsize instance or move to a lower tier |
| Balanced | 40%–70% CPU or memory usage | Optimal - no immediate waste | Maintain; monitor for seasonal drift |
| Over-utilised | Sustained >80% CPU or memory for extended periods | Performance risk - potential cost increase of ~20% | Scale up, scale out, or optimise code |
| Spiky | High variance, periodic demand peaks | Unpredictable - budget risk | Implement or tune autoscaling |
Use the same classifications in weekly and monthly reviews.
Step 4: Build a Repeatable Reporting and Governance Process
Cloud estates don’t sit still. They shift all the time as teams ship code, spin up services, and change workloads. That’s why Steps 1–3 need to become part of a fixed reporting rhythm for engineering, finance and platform teams. Use the utilisation classes from Step 3 to shape weekly exception reports and monthly trend reviews.
Create Weekly and Monthly Utilisation Reports for Engineering and Finance
Weekly and monthly reports do different jobs, so it helps to keep them separate.
Weekly reports should focus on what needs attention now: recent exceptions, tagging gaps, and any changes that call for follow-up. Monthly reports should take a broader view, covering spend by team or tag, trend lines over time, and a summary of actions taken and savings realised.
Use showback to build cost awareness. Then move to chargeback when teams own budgets and make their own spending decisions.
Automate Alerts, Tagging Checks and Review Workflows
Manual checks fall apart fast in a changing cloud estate. A better approach is to feed the same thresholds into alerts and tagging checks, so the rules stay consistent across the process.
Automate threshold alerts, tag checks and review workflows so sustained underuse, overuse and ownership gaps reach the right team fast. Then route alerts and tagging failures into a weekly review workflow, giving engineering, finance and platform teams a clear way to act on issues without delay.
Conclusion: Key Steps for Accurate Cloud Utilisation Analysis
Repeatable utilisation analysis turns one-off findings into lasting savings. Hokstad Consulting helps teams build the reporting and governance needed to do that.
FAQs
How do I avoid downsizing too aggressively?
Use data-led decisions. Look at at least two to four weeks of past metrics, then size for the 95th percentile rather than the average. That gives you enough headroom for normal spikes instead of leaving you short the moment traffic jumps.
Make changes in small, reversible steps. A canary deployment is a good way to do that. Then monitor results for a full business cycle so you’re not judging too soon. If needed, switch instance families to fit the bottleneck, and test on non-critical systems first.
What if memory metrics are missing?
Missing memory metrics usually mean the right monitoring agent isn’t installed on your virtual machines.
Without that agent, your cloud platform can usually only show top-level metrics like CPU usage and network throughput. Memory utilisation data often won’t appear at all.
To fix this, install and set up the correct monitoring agent for your cloud provider so it can collect and report detailed memory utilisation metrics.
How often should utilisation reviews happen?
Don’t wait for quarterly reviews. Check usage reports weekly so you can spot trends and inefficiencies before they turn into serious financial strain.
Back that up with monthly team cost reviews and continuous automated monitoring. That way, resources stay in line with workload demands, and you can catch budget anomalies and performance drift as they happen.