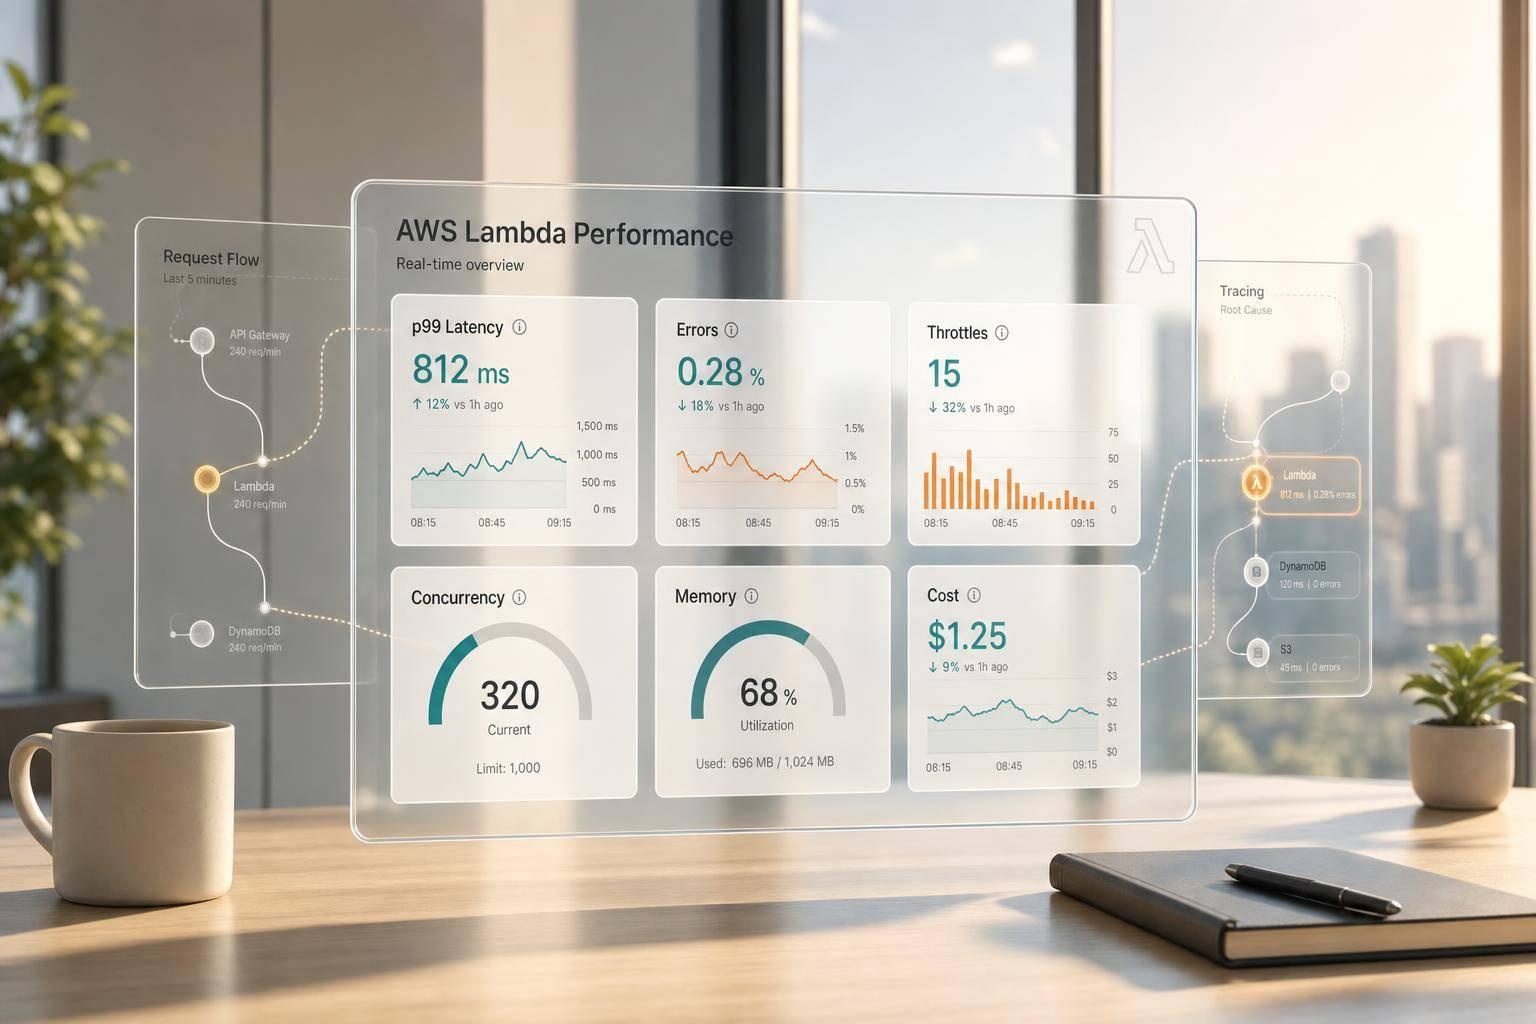
If I want to keep AWS Lambda fast and stable, I watch six things first: latency, errors, throttles, concurrency, memory use, and cost. That gives me a clear view of user impact, scaling pressure, and monthly spend in £ without adding too much tooling too early.
Here’s the short version:
- I start with CloudWatch and track p95/p99 Duration, Errors, Throttles, ConcurrentExecutions, and MaxMemoryUsed
- I set alarms early, such as:
- p99 Duration above 80% of timeout
- Errors above 1%–5% over 5 minutes
- Throttles above 0
- Concurrency above 80% of the limit
- Memory use above 85%
- If CloudWatch shows a problem but not the cause, I turn to X-Ray to split delay between cold starts, handler time, and downstream calls
- If Lambda is part of a longer chain across accounts, Regions, or non-AWS services, I add broader observability tools
- Then I use the data to tune memory, timeout, reserved concurrency, and Provisioned Concurrency
- I also keep logs on a 30-day retention setting to avoid extra storage spend
A simple rule helps: watch the basics first, trace the slow path next, then tune only the setting linked to the metric that moved. For example, if MaxMemoryUsed is above 85%, I look at memory. If Throttles appear, I look at concurrency. If Init Duration is high, I look at cold starts.
::: @figure 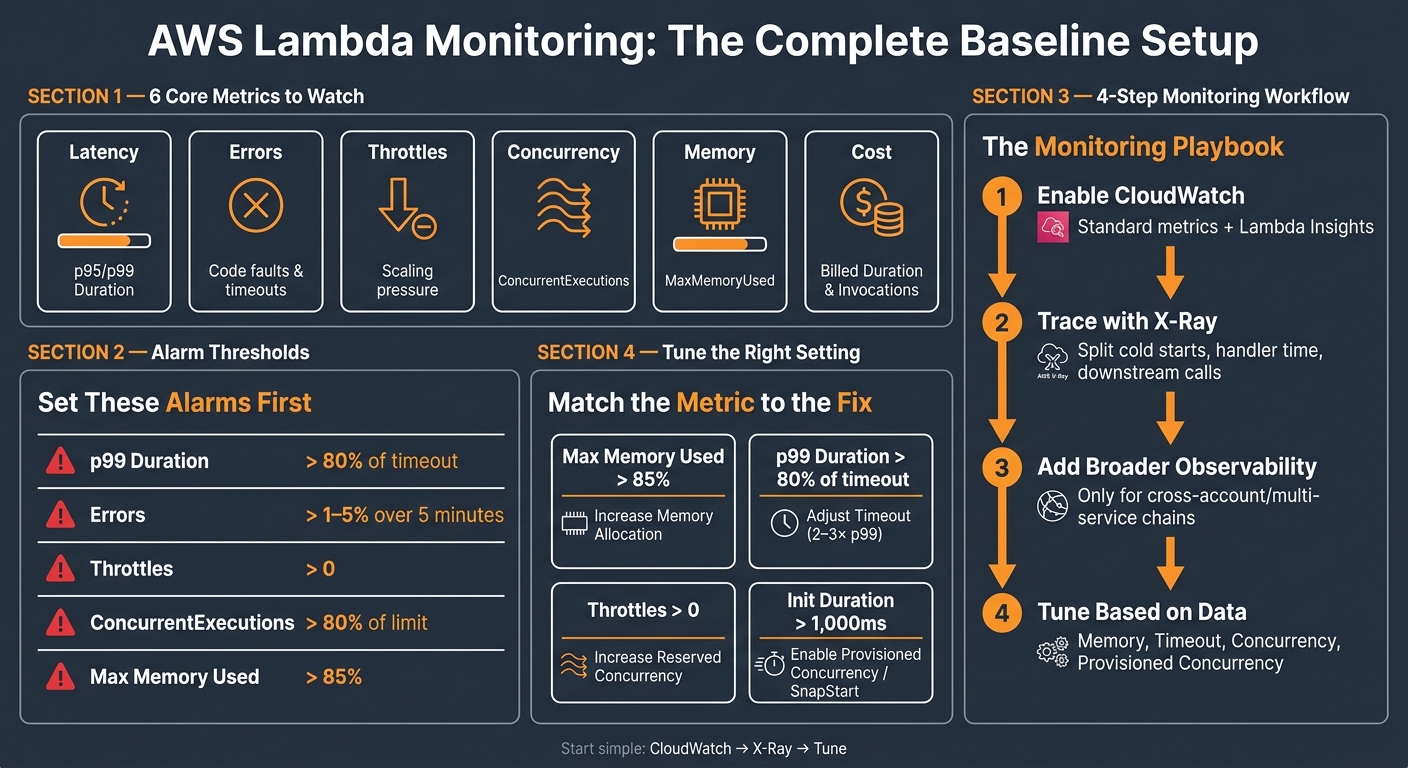 {AWS Lambda Monitoring: Native Tools vs Extended Platforms at a Glance}
:::
{AWS Lambda Monitoring: Native Tools vs Extended Platforms at a Glance}
:::
AWS Lambda Performance Tuning | Serverless Office Hours
Need help optimizing your cloud costs?
Get expert advice on how to reduce your cloud expenses without sacrificing performance.
Quick overview
| Area | What I check | What it tells me |
|---|---|---|
| Speed | p99 Duration, Init Duration | Slow requests, timeouts, cold starts |
| Failures | Errors | Code faults, timeouts, config issues |
| Scale | Throttles, ConcurrentExecutions | Whether requests are being blocked or limits are near |
| Resource use | MaxMemoryUsed | Whether memory is too low for the workload |
| Cost | Billed Duration, Invocations | How usage turns into monthly spend |
| Root cause | X-Ray traces | Where time is going in the request path |
I’d treat this as the baseline setup for most Lambda workloads: CloudWatch for alerting, Lambda Insights for system data, X-Ray for trace detail, and tuning based on what the metrics show.
Step 1: Enable native AWS monitoring in CloudWatch
With your baseline thresholds in place, CloudWatch is the first place to put them to work. This is where those numbers stop being reference points and start becoming alerts you can act on. AWS publishes standard Lambda metrics to CloudWatch every minute by default [5][6].
Use standard CloudWatch Lambda metrics
You can check your function’s metrics in the Monitoring tab in the Lambda console, or in the CloudWatch console under the AWS/Lambda namespace [5][7]. For Duration, use p99 so you can spot tail latency instead of just looking at the average [1][2][6].
Start with the core set of metrics:
- Invocations
- Errors
- Duration
- Throttles
- ConcurrentExecutions
These are the first signals to watch [6]. If a metric suddenly spikes, or drops to zero, that’s usually a sign that something changed and needs a closer look [6]. Throttles deserve their own check, as they can point to scaling limits before other issues show up [6][4].
If the trend changes but the reason isn’t obvious, that’s the point where Lambda Insights helps.
Turn on Lambda Insights and Application Signals
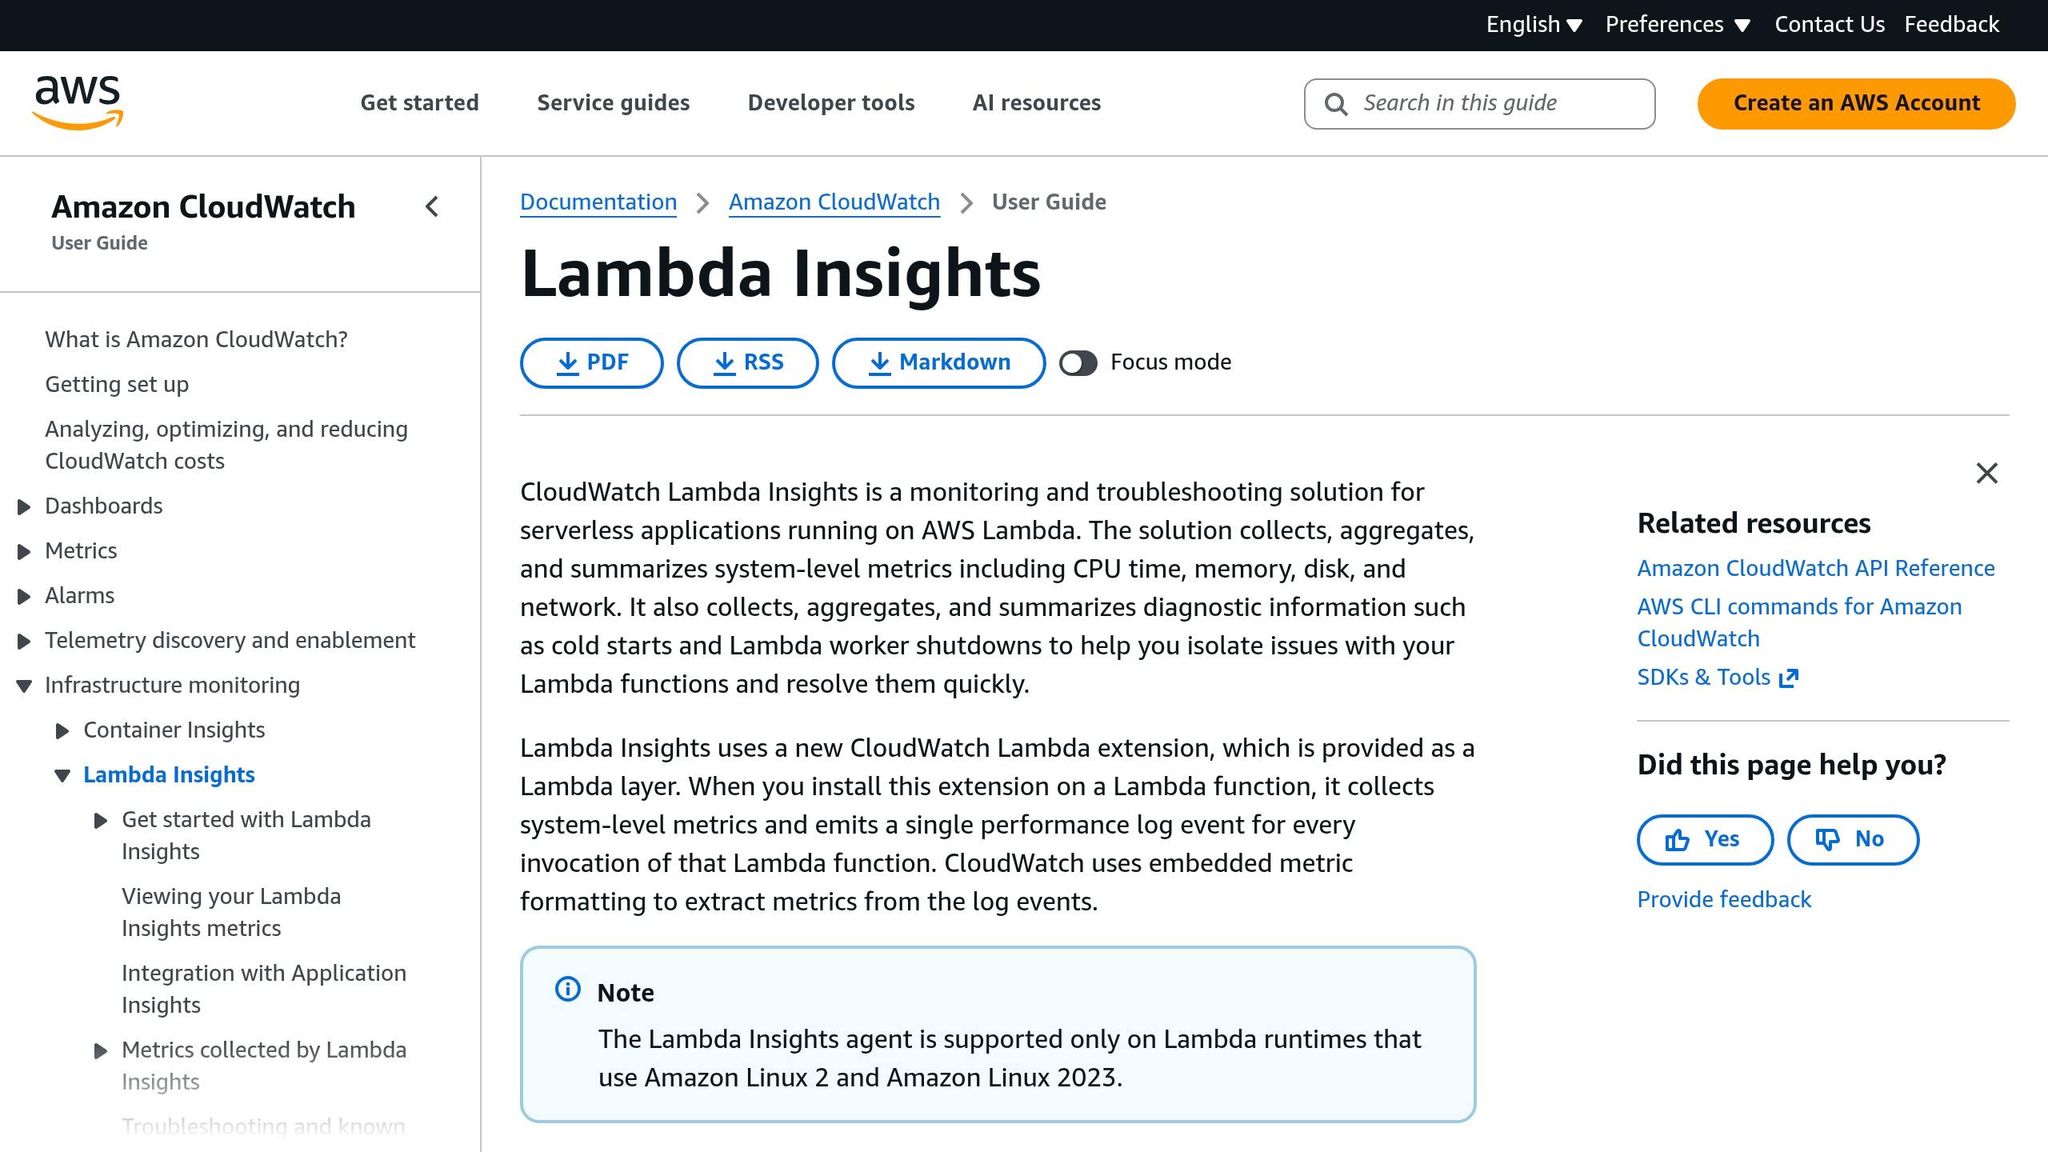
Standard metrics tell you that something is wrong. Lambda Insights helps show why. To enable it, open your function in the Lambda console, go to Configuration, choose Monitoring and operations tools, and turn Enhanced monitoring on [1].
Once it’s active, Insights adds system-level data that standard metrics don’t show: actual memory use, CPU time, disk and network I/O, and cold start init duration tracked separately from execution duration [1][6]. That extra detail matters. A function can look fine on the surface and still be running close to the edge. If Max Memory Used stays within 10–20% of the memory limit, you’re getting close to an out-of-memory failure [6].
For a service-level view, Application Signals brings RED metrics: Requests, Errors, and Duration, all in one place, with no code changes needed. Enable it in the CloudWatch console by going to Application Signals and selecting Enable [8]. It’s especially handy when Lambda is only one part of a longer request chain, because it ties traces to logs and helps surface downstream latency.
Set up CloudWatch alarms for key issues
For critical functions, start with these four alarms:
| Metric | Alarm threshold | Why it matters |
|---|---|---|
| Duration (p99) | > 80% of configured timeout | Catches degradation before timeouts start failing [2][6] |
| Errors | > 5% over 5 minutes (via metric math: Errors ÷ Invocations × 100) | More reliable than raw counts for variable traffic [6] |
| Throttles | > 0 | Throttled requests do not appear in Errors [6][4] |
| ConcurrentExecutions | > 80% of reserved or account limit | Early warning before scaling headroom runs out [6][4] |
For Errors, use metric math instead of a raw error count. The reason is simple: 1 error out of 10 invocations tells a very different story from 1 error out of 10,000. Looking at error rate gives you the signal in context. Also note that CloudWatch alarms are billed separately [5].
When one of these alarms fires, trace the request path so you can find where the slowdown or failure starts.
Step 2: Trace slow requests with AWS X-Ray
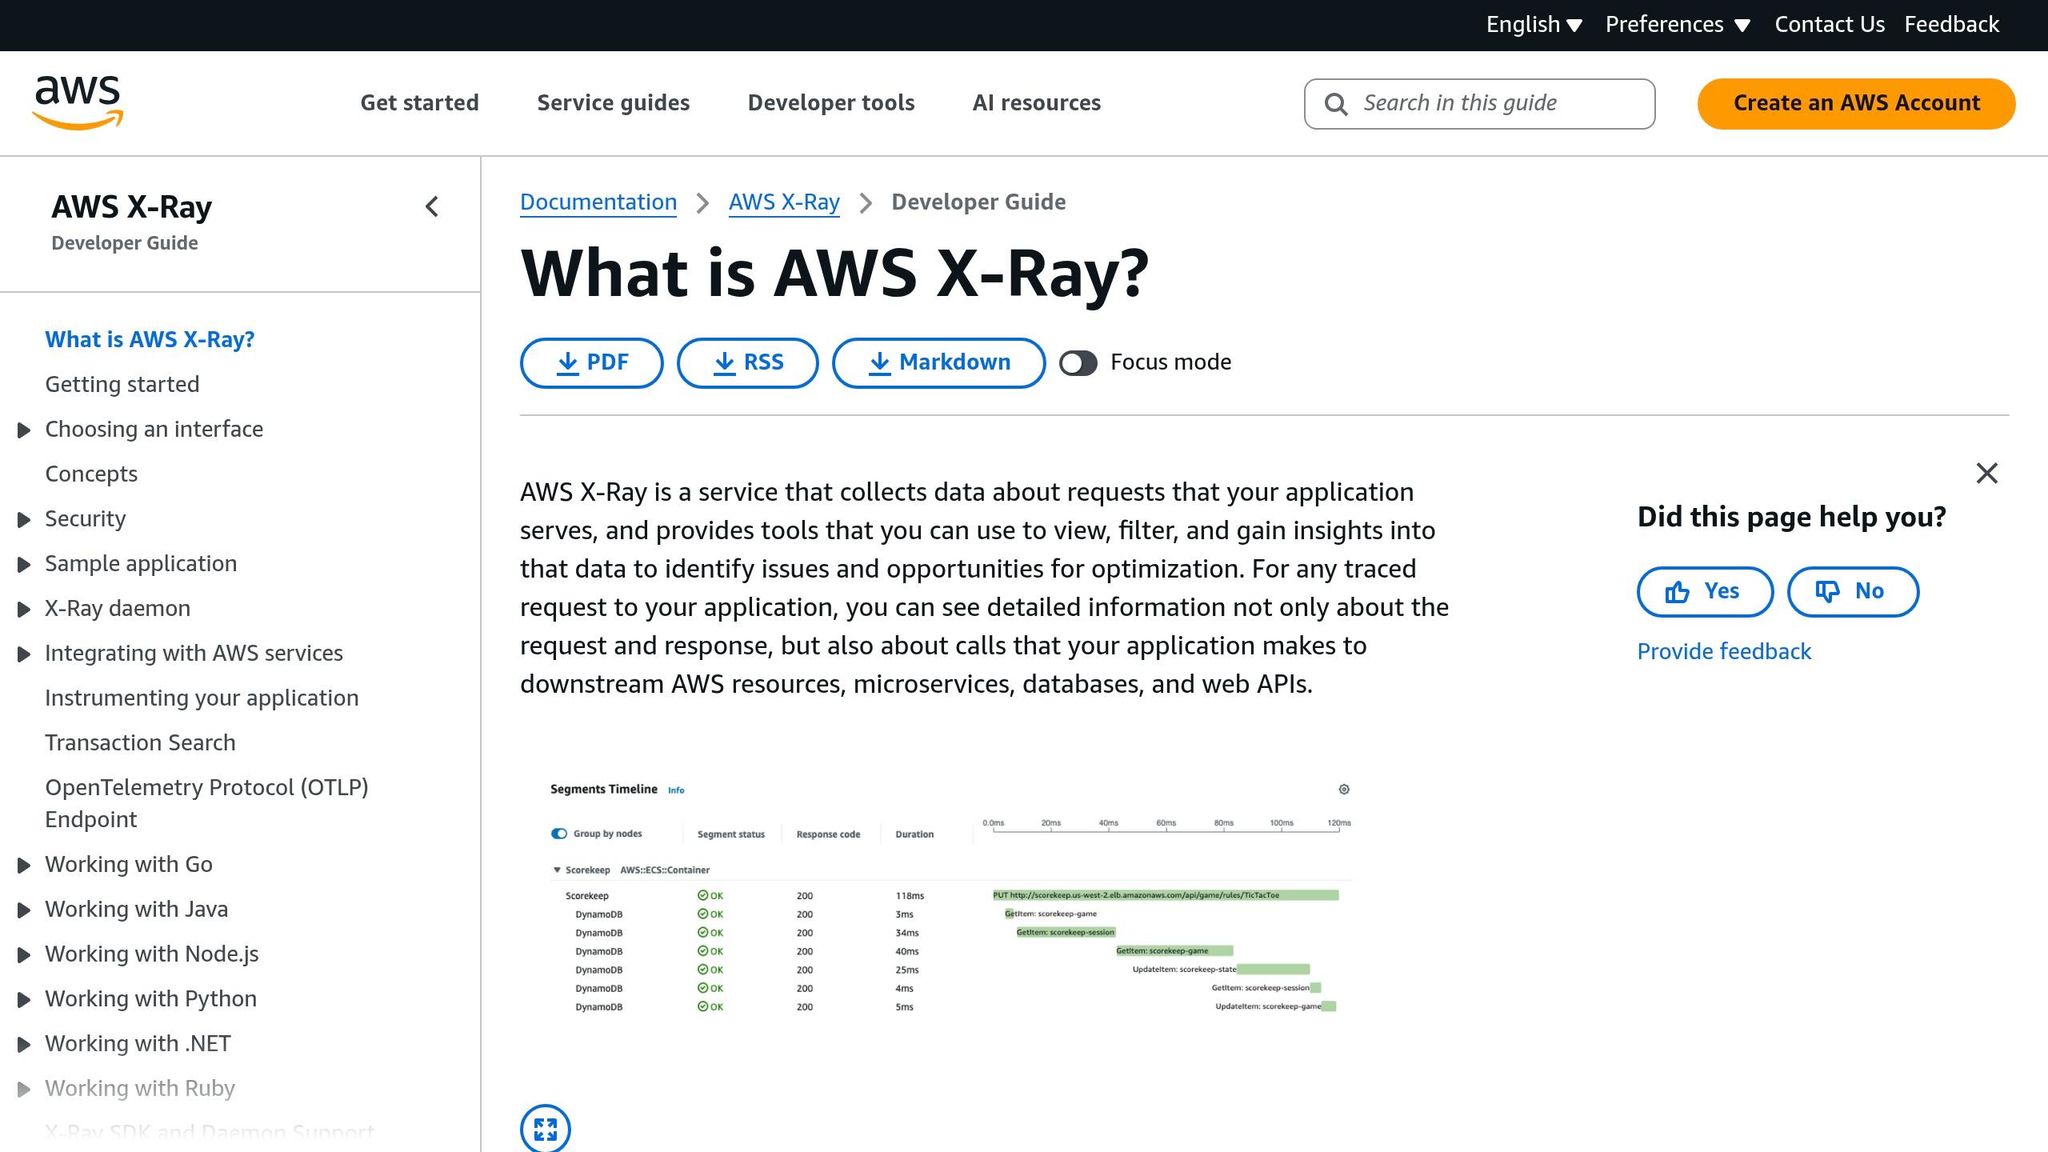
Use X-Ray when CloudWatch shows a spike but not the cause. CloudWatch can tell you something is wrong. X-Ray shows where the time goes by breaking a request into trace segments across the request path.
Enable active tracing for Lambda functions
To turn tracing on, open the function in the Lambda console, go to Configuration, select Monitoring and operations tools, choose Edit, and enable Active tracing [9][11].
You can also do it with the CLI:
aws lambda update-function-configuration --function-name <name> --tracing-config Mode=Active
Your function's execution role also needs the AWSXRayDaemonWriteAccess managed policy, or the matching xray:PutTraceSegments and xray:PutTelemetryRecords permissions [9][10].
Start with the functions tied to your highest-priority alarms. That gives you the fastest path to the issue that's hurting users most.
Use traces to find bottlenecks
Each Lambda trace has two top-level segments: AWS::Lambda, which covers service overhead and environment setup, and AWS::Lambda::Function, which covers the work done by your code [9][10].
The trace timeline helps you split the delay into cold starts, handler time, and downstream calls. That makes the next step much clearer: do you need to trim cold starts, speed up code, or look at a dependency?
| Subsegment | What it shows | Slow? Look here |
|---|---|---|
| Initialization / Init | Cold start - runtime setup and global code execution | Large deployment packages or heavy init logic |
| Invocation | Your handler execution time | Slow code or CPU-heavy work |
| AWS SDK subsegments | Calls to DynamoDB, S3, SQS, and similar services | Downstream service latency or throttling |
| Overhead | Freeze/thaw overhead | Usually minimal; high duration may indicate extension issues |
The Service Map makes this easier to scan at a glance. Green means success, red points to 5xx, and yellow shows 4xx [14].
You can also add custom subsegments for external APIs and databases so their latency shows up in the trace. In Python, patch_all() at module level can instrument boto3 calls. In Node.js, use AWSXRay.captureAWSv3Client() to wrap AWS SDK v3 clients [12][13]. Once those subsegments show up, intermittent timeouts and slow downstream calls are far easier to pin down.
Step 3: Add broader observability and compare your options
Use broader observability only when CloudWatch and X-Ray stop showing the full request path. In plain terms, don’t add more tooling just because you can. Add it when Lambda is part of a bigger request chain, or when costs and traffic are shared across more than one service.
Set up third-party monitoring tools
Third-party observability platforms help most in three cases.
- Cross-account and cross-region correlation, where you need to follow activity across more than one AWS account or Region [18]
- High-concurrency environments, where high-concurrency functions can overwrite gauge datapoints at the same timestamp [18]
- Multi-service request chains, where AWS-native tracing ends at the edge of a non-AWS dependency
These tools are usually deployed through Lambda Layers or Extensions, so you can add monitoring without changing your core application logic [16][17]. That’s a big win when you want more visibility without rewriting code.
They also show near-real-time metrics for cold starts, cost and memory use [17][18]. To keep that data usable, apply the same tags across every tool, such as env, service and version. That way, you can jump between metrics, traces and logs without losing the thread [20].
Native AWS tools vs extended monitoring platforms: a comparison
Start with the lightest tool that gives you the signal you need. If that signal is still incomplete, then step up to broader monitoring. That approach keeps things simpler and avoids extra noise.
Broader tooling tends to help in three areas:
- Cross-service correlation: Native AWS tools trace activity within AWS service chains. Third-party platforms can follow requests across accounts, regions and non-AWS dependencies [16][17].
- Faster alerting: CloudWatch alarms rely on static thresholds. Extended platforms can use anomaly detection and plug straight into incident channels [16].
- Payload and debug visibility: If you need to inspect the actual request or response to debug a failure without reproducing the event, that’s usually something extended monitoring platforms provide [17][19].
How Hokstad Consulting can help

Hokstad Consulting helps teams put monitoring automation, CI/CD integration and telemetry routing into production. That includes setups where Lambda functions run inside a private VPC and need AWS PrivateLink or a proxy to reach external monitoring platforms [19].
Once those signals are flowing, you can use them to tune memory, timeout and concurrency in the next step.
Step 4: Use monitoring data to tune Lambda performance and cost
Monitoring only helps if you act on what it shows. In Lambda, the main knobs are memory, timeout, and concurrency. When an alarm fires, change the setting that matches the metric instead of guessing.
Adjust memory, timeout and concurrency settings
Memory: If Max Memory Used goes above 85%, increase the memory allocation to reduce the risk of out-of-memory failures [2][6]. If a function is compute-heavy, test it with AWS Lambda Power Tuning at several memory levels. More memory can sometimes lower cost because the function finishes sooner [2]. One thing to watch: for single-threaded functions, CPU gains tend to level off above 1,792 MB [2].
Timeout: Tight timeout settings lead to avoidable failures. A good rule is to set timeout at 2–3× p99 duration [6]. But check X-Ray traces before you change anything. If the p99 jump comes from a slow DynamoDB call rather than your own code, adding memory will do nothing [4][6].
Concurrency: Throttle alarms need to stand on their own because throttled requests are not counted in Errors [4]. If ConcurrentExecutions often goes above 80% of your reserved limit, increase that limit before you run into the regional default of 1,000 concurrent executions [4][21]. If you use Provisioned Concurrency, keep an eye on ProvisionedConcurrencyUtilization. Once it moves above 90%, you're close to on-demand cold starts [21]. And if the lag is outside the function itself, the next step is to trace the dependency.
| Setting | Metric to watch | When to act |
|---|---|---|
| Memory |
Max Memory Used / Duration
|
Usage above 85%, or compute-bound duration is high [2][6] |
| Timeout |
Duration (p99) |
p99 exceeds 80% of configured timeout [2][4] |
| Concurrency |
Throttles / ConcurrentExecutions
|
Throttles above 0, or executions above 80% of limit [4][6] |
| Provisioned Concurrency |
Init Duration / ProvisionedConcurrencyUtilization
|
Cold starts affecting user experience, or utilisation above 90% [2][21] |
Cut cold starts and dependency delays
If traces show the delay is happening during initialisation, not in the handler code, cold starts are the issue. Watch Init Duration, and fix user-facing cold starts above 1,000 ms [2][4][15].
Two changes usually give the biggest gains. Move SDK clients and database connections outside the handler and into the global scope so warm invocations can reuse them [2][4]. Then trim the deployment package by removing dependencies you don't use. Smaller packages download and unpack faster during initialisation [15]. For Java functions, SnapStart can cut cold start times from over 5 seconds to under 400 ms [15].
Cold starts don't increase Errors or Throttles, which is why teams often miss them. To spot them, parse REPORT lines or turn on Lambda Insights [4][6].
If your function runs inside a VPC and calls AWS services, use VPC endpoints. Sending that traffic out through the internet adds latency to every invocation, not just cold starts [2].
Conclusion: Build a monitoring setup that stays useful
A simple setup goes a long way:
- Enable Lambda Insights and X-Ray active tracing
- Alert on p99 duration and throttles
- Tune memory with AWS Lambda Power Tuning
- Set a 30-day CloudWatch log retention policy to avoid indefinite storage costs [3]
FAQs
Which Lambda metrics matter most first?
Prioritise these core metrics first:
- Errors: failed invocations caused by logic bugs, timeouts, or unhandled exceptions
- Duration: track p95 and p99, not averages, so you can spot tail latency
- Throttles: rejected requests when concurrency limits are hit
- Invocations: baseline traffic and any unexpected spikes or drops
When should I use X-Ray instead of CloudWatch?
Use Amazon CloudWatch for primary logging, standard metrics and alerting. It gives you a solid baseline for monitoring performance, errors and overall system usage.
Then bring in AWS X-Ray when you need distributed tracing across multiple services. CloudWatch can tell you something’s wrong. X-Ray helps you track down where the delay is coming from, whether that’s a call to DynamoDB, SQS or S3.
How do I reduce cold starts and Lambda costs?
Cut cold starts by keeping your deployment package lean, stripping out dependencies you don’t use, moving heavy setup work outside the handler, and turning on SnapStart for Java when it fits.
For cost control, tune memory with care. More memory can sometimes shorten run time enough to make the higher per-ms price worth it. Use AWS Lambda Power Tuning to spot the right trade-off, then check results in Lambda Insights or CloudWatch Metrics before making more changes.