
Zero downtime monitoring ensures uninterrupted system availability during deployments and infrastructure changes. For UK businesses, downtime costs can reach £3,000 per minute, making it critical to prevent disruptions. Open-source tools like Prometheus, Grafana, Zabbix, and SigNoz offer cost-effective, customisable solutions to monitor metrics, logs, and traces in real time. These tools support deployment strategies such as blue-green, canary, and rolling updates, enabling businesses to detect and resolve issues before they impact users.
Key benefits include:
- Improved reliability: Up to 90% fewer errors during releases.
- Cost savings: Reduce cloud spending by 30–50%.
- Faster deployments: Up to 75% quicker release cycles.
No Downtime in Production: A DevOps Toolkit for Safer CI/CD
Zero Downtime Deployment and Monitoring Basics
Zero downtime deployment hinges on having real-time visibility at every step of your release process. Monitoring acts as your safety net, catching potential issues before they spiral into user-facing problems. These two elements - monitoring and deployment - work hand in hand. Monitoring provides a continuous feedback loop to enable safer deployments, while deployment strategies ensure you can quickly roll back if something goes wrong.
How Monitoring Supports Zero Downtime Deployments
Modern deployment strategies are built on the foundation of effective monitoring. Each approach uses monitoring data to make critical decisions about whether to proceed or pause during the release.
Take blue-green deployments: they rely on two identical production environments. Monitoring ensures the green
environment is functioning properly before you shift traffic from the current blue
environment. Similarly, canary releases direct a small portion of traffic to the new version, with monitoring comparing performance metrics - like error rates and latency - between the old and new versions. This also includes tracking business metrics, such as conversion rates. Then there are rolling updates, where individual service instances are updated one at a time. Here, monitoring ensures that only healthy instances, as confirmed by health checks, remain in the traffic pool.
To make these strategies work, monitoring tools deliver three essential observability components: real-time performance metrics, log aggregation for debugging, and distributed tracing to pinpoint performance issues across complex microservices architectures [2][5].
| Deployment Strategy | Monitoring Focus | Key Metrics Tracked |
|---|---|---|
| Blue-Green | Pre-deployment validation | Health checks, resource usage, connectivity tests |
| Canary | Comparative analysis | Error rates, latency, conversion rates, user impact |
| Rolling Update | Instance-level health | Pod status, readiness probes, traffic distribution |
These capabilities lay the groundwork for integrating open-source tools, which can further streamline deployment and monitoring.
Why Choose Open-Source Monitoring Tools
For UK businesses adopting zero downtime deployments, open-source monitoring tools offer more than just cost savings. Their community-driven ecosystem provides extensive plugin options, integrations, and detailed documentation of best practices. For instance, Jenkins supports flexible CI/CD pipelines with plugins that integrate monitoring checks at every deployment stage [5]. Similarly, ArgoCD facilitates blue-green deployments, rolling updates, and canary releases, complete with built-in health monitoring and rollback features [5].
However, implementing these tools requires technical expertise. Organisations need skilled DevOps professionals to handle setup, configuration, and maintenance. This includes integrating CI/CD pipelines, defining appropriate alert thresholds, and securing communication between monitoring components [4]. While this can be challenging, it often leads to a deeper understanding of the system and better optimisation of the monitoring infrastructure.
Open-source tools also allow businesses to build tailored observability stacks suited to their specific deployment needs, avoiding the cost of unused features [5][6]. This adaptability is especially useful for organisations transitioning from manual processes to automated, zero downtime deployments. They can start small and scale their monitoring capabilities as their systems grow more sophisticated.
For companies partnering with Hokstad Consulting on DevOps transformation, combining open-source monitoring tools with expert guidance can speed up the shift to zero downtime deployments. At the same time, this approach helps optimise cloud infrastructure costs. Open-source solutions offer the flexibility needed to meet varying business requirements and comply with UK industry standards.
3 Core Components of Observability for Zero Downtime
Achieving zero downtime deployments hinges on having a clear view of your entire system. This is made possible through three key observability pillars: metrics, logs, and traces. Together, these components shift troubleshooting from being reactive to proactive, allowing teams to address potential issues before they disrupt users.
The interplay of these three elements creates a comprehensive approach to observability, enabling the proactive monitoring needed to ensure uninterrupted service.
Metrics: Tracking System Performance in Real-Time
Metrics form the backbone of observability by offering quantifiable insights into system performance, especially during deployments. Key metrics such as CPU usage, memory consumption, error rates, and request latency act as early warning signals. For instance, a sudden spike in error rates or latency during a deployment could signal a problem, giving teams the chance to pause or roll back changes before users are affected.
To make the most of metrics, teams often set up alerts for specific thresholds. For example, if error rates increase by 5% during a canary deployment, an alert can trigger immediate investigation and action, reducing the risk of downtime [2].
Tools like Prometheus and Zabbix are highly effective for collecting and analysing metrics. Prometheus, in particular, is designed to scale horizontally, making it capable of handling large data volumes. Pairing it with Grafana allows teams to create custom dashboards tailored to specific deployment scenarios.
By closely monitoring metrics, teams can not only maintain system reliability but also optimise infrastructure usage, cutting unnecessary costs. When anomalies are detected, logs provide the detailed context needed to dig deeper into the issue.
Logs: A Centralised Resource for Debugging
While metrics provide the numbers, logs give the narrative. Centralised log aggregation pulls logs from across your system into one searchable location, making it a vital tool for debugging issues during deployments. Platforms like Grafana Loki and the ELK Stack streamline this process, saving valuable time by consolidating logs from multiple services and environments.
This approach is particularly important when you consider that over 60% of outages in cloud-native environments stem from deployment or configuration changes [5]. Without centralised logs, teams often waste time searching through disparate systems to piece together what went wrong.
To get the most out of log aggregation, it’s important to follow best practices like:
- Standardising log formats across all services
- Setting up real-time alerts for critical errors
- Retaining logs long enough to support post-deployment analysis
For example, during blue-green deployments, centralised logs can quickly reveal if the new environment is generating unexpected errors, enabling teams to make quick rollback decisions. Structured logging - complete with consistent timestamps and severity levels - further simplifies troubleshooting, making it easier to correlate events across services.
When logs and metrics alone can’t pinpoint an issue, distributed tracing steps in to map out the request flows and uncover deeper insights.
Distributed Tracing: Unravelling Complex Architectures
In modern systems built on microservices or distributed applications, distributed tracing is indispensable. It offers end-to-end visibility by tracking how requests move through the system, providing insights that metrics and logs alone can’t offer. Tools like Jaeger and SigNoz are particularly effective at visualising request flows, helping teams identify bottlenecks and problem areas.
This level of detail is crucial during deployment strategies like canary releases or rolling updates. For instance, if a new version increases latency in a specific microservice, tracing can pinpoint the exact service and operation causing the issue. Without this visibility, teams are often left guessing when performance problems arise in distributed systems.
Distributed tracing also integrates well with other deployment tools. For example, service meshes like Istio and feature flag systems can work alongside observability tools to enforce service-level objectives and automate traffic management during rollouts. For UK businesses undergoing DevOps transformation with Hokstad Consulting, combining tracing with metrics and logs creates a strong observability framework. This approach not only supports zero downtime but also helps identify inefficiencies that could inflate cloud infrastructure costs.
| Component | Primary Function | Key Benefits During Deployments |
|---|---|---|
| Metrics | Real-time performance monitoring | Early detection of issues, automated rollback triggers |
| Logs | Detailed event recording | Faster debugging, root cause analysis, audit trails |
| Traces | Request flow visibility | Pinpoint issue sources, identify performance bottlenecks |
Top Open-Source Tools for Zero Downtime Monitoring
Choosing the right open-source monitoring tools is crucial for maintaining zero downtime. The best options excel in real-time data processing, customisable alerts, scalability, integration with CI/CD pipelines, and support for metrics, logs, and traces. For businesses in the UK, these tools are particularly appealing because they eliminate licensing costs and allow for tailored solutions to meet specific infrastructure requirements [4][7].
Here’s a closer look at three standout tools that offer real-time insights, flexible alerting, and comprehensive observability for deployments. These tools align with the observability principles discussed earlier, ensuring your operations remain seamless.
Zabbix for Infrastructure and Application Monitoring
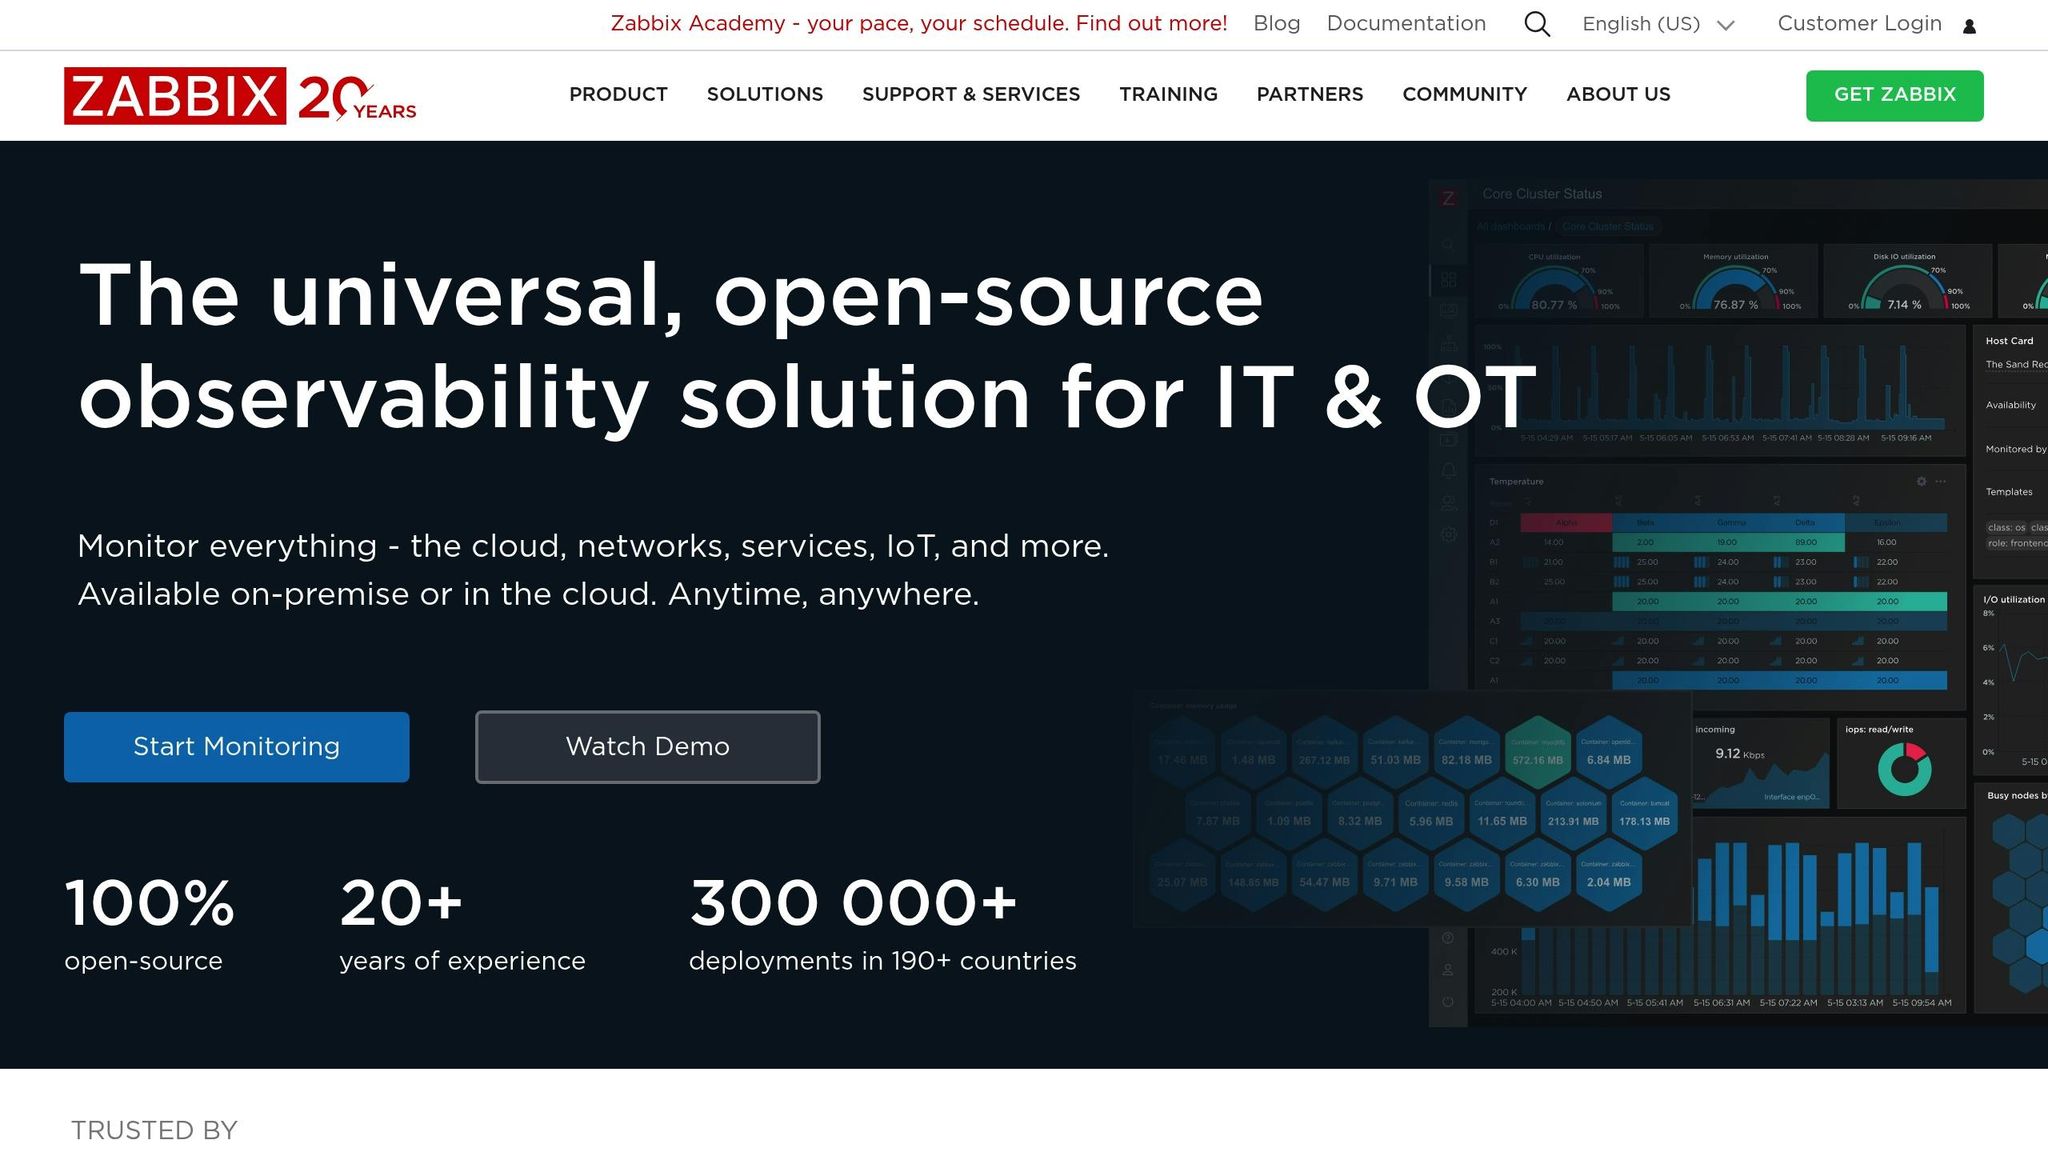
Zabbix is a tried-and-tested option, perfect for large-scale deployments. It shines in monitoring networks, servers, and applications, offering unparalleled scalability.
One of its standout features is the template-based monitoring system, which simplifies the onboarding of new systems. Instead of configuring each server manually, teams can use pre-built templates to apply settings across hundreds of systems in one go. This not only saves time but also ensures consistency across the board.
Webhook integrations are another strength, enabling Zabbix to work seamlessly with CI/CD platforms. When issues arise during deployments, Zabbix can automatically trigger rollbacks or escalate the problem to engineering teams, eliminating the need for manual intervention.
Its distributed monitoring architecture ensures resilience and high availability, making it an excellent choice for UK organisations with hybrid or multi-cloud environments. Whether monitoring on-premises data centres, public cloud instances, or edge locations, Zabbix provides visibility across all environments from a single interface [4][7].
For businesses with complex infrastructure, Zabbix offers the detailed control needed to monitor everything from network hardware to application performance metrics - all while supporting zero downtime operations.
OneUptime for Integrated Observability
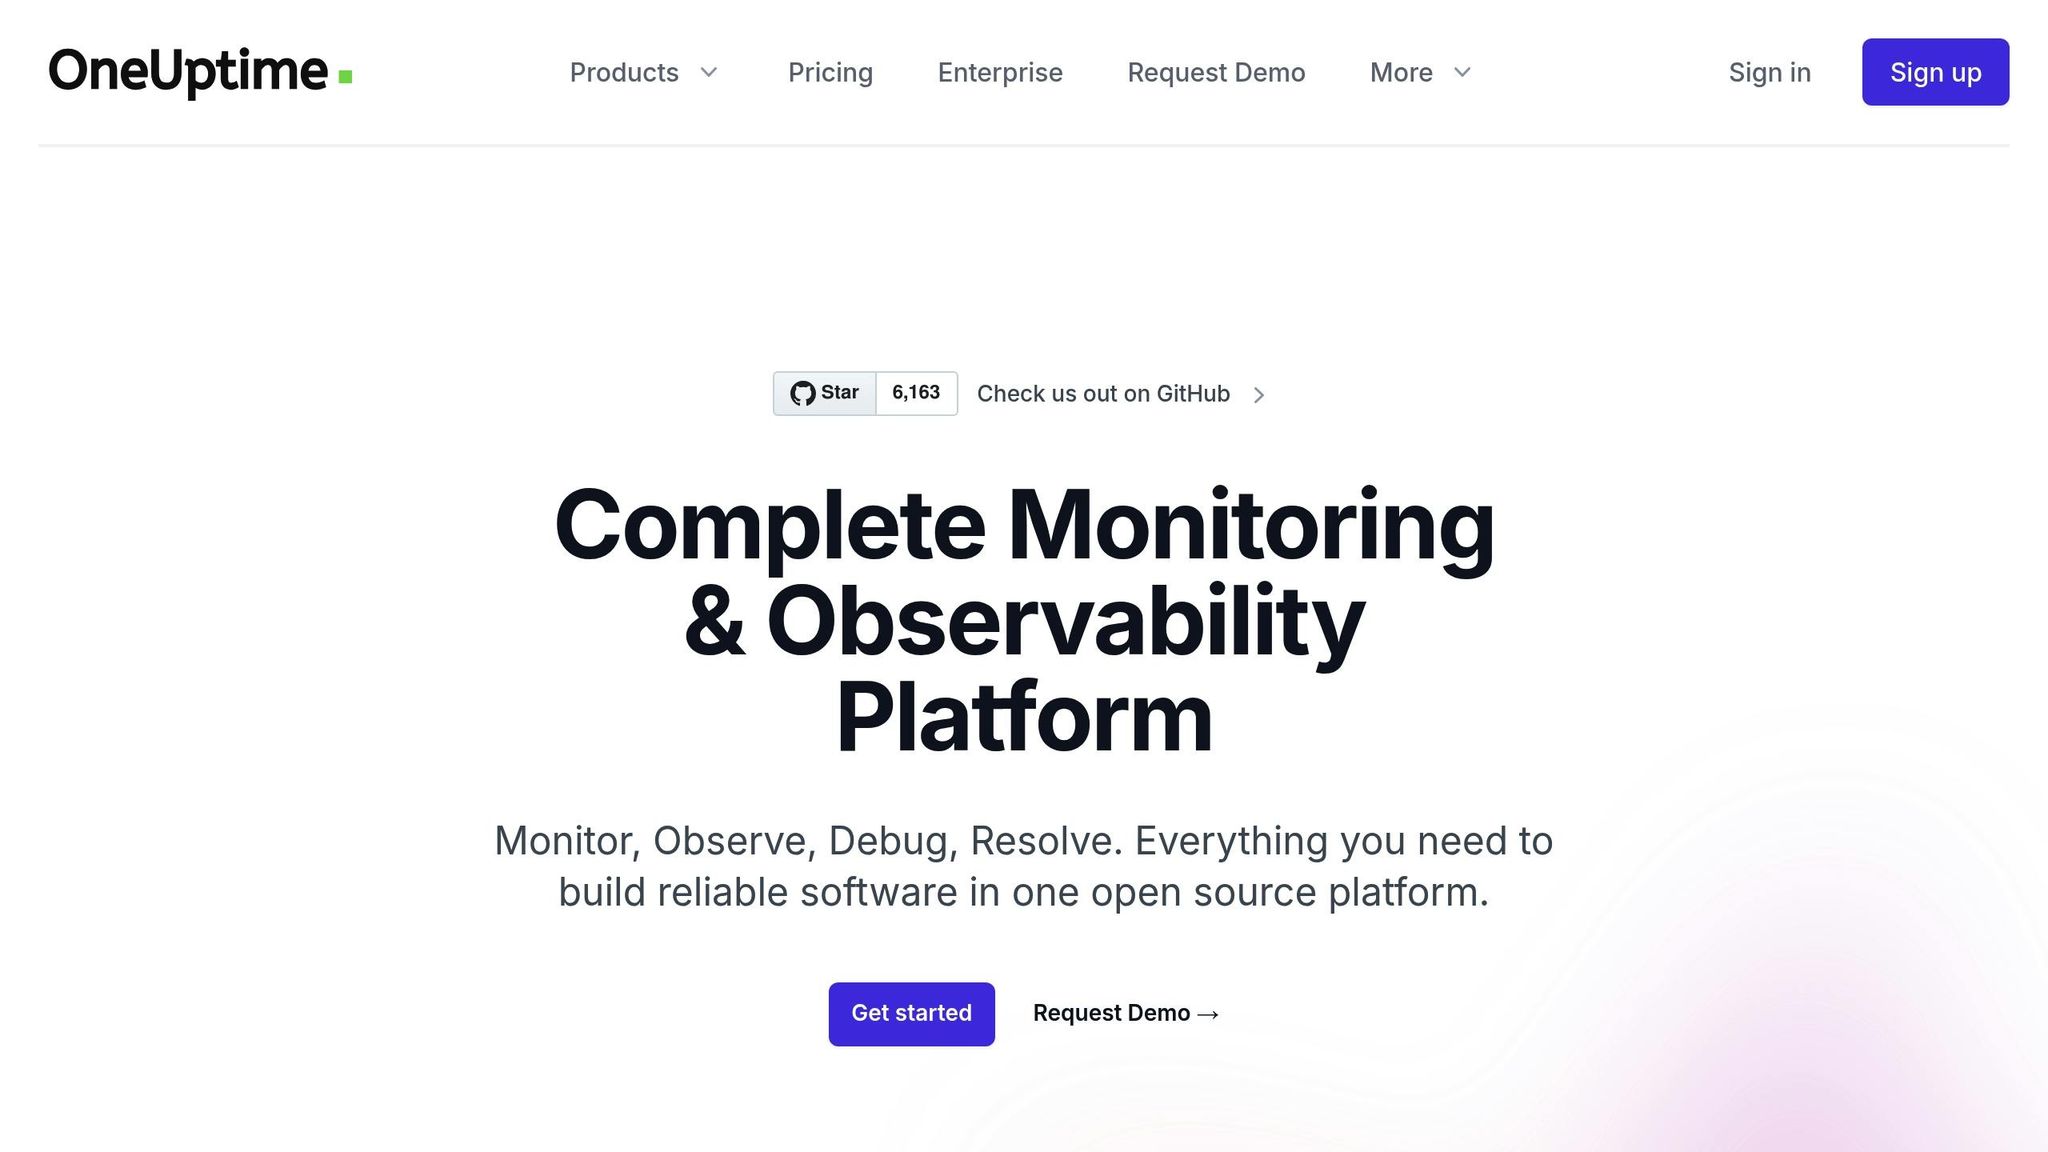
OneUptime combines uptime monitoring, log management, and application performance monitoring (APM) into a single platform. This integration simplifies deployment workflows by offering unified dashboards, automated incident management, and real-time alerts, reducing the need to juggle multiple tools.
Its centralised dashboard is a game-changer for operational efficiency, allowing teams to view metrics, logs, and uptime data in one place. This eliminates the need to switch between tools, speeding up incident resolution and improving response times.
OneUptime supports both on-premises and cloud setups, making it a practical option for businesses aiming to minimise downtime while streamlining their monitoring processes. When an issue arises, teams can immediately access all relevant data - uptime status, logs, and performance metrics - through a single interface. This quick access reduces the time spent troubleshooting and helps prevent prolonged downtime.
SigNoz for Application-Level Observability
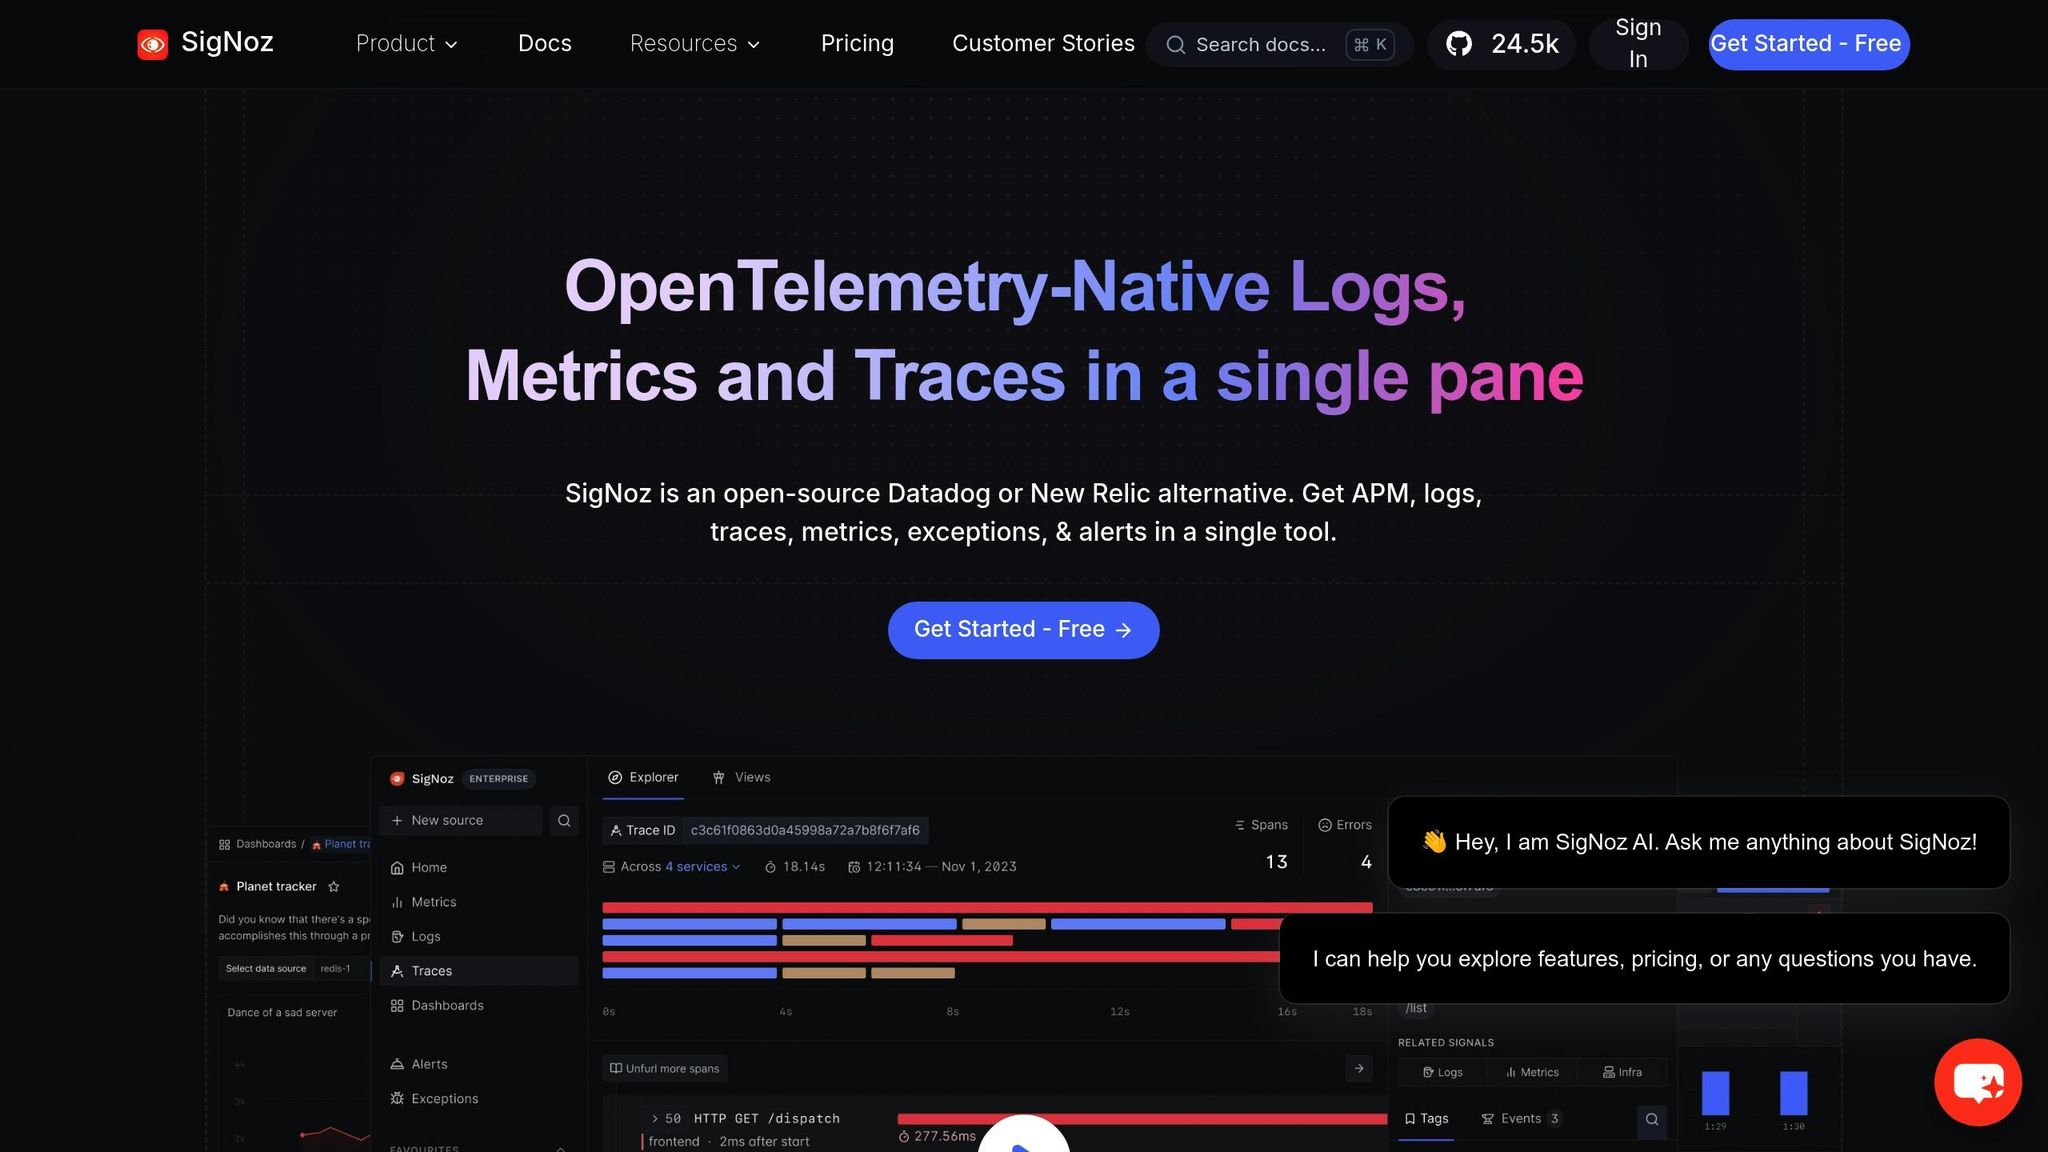
SigNoz focuses on application-level observability, offering metrics, logs, and distributed traces in a unified platform. Built on OpenTelemetry standards, it excels in providing deep insights into microservices-based architectures [7].
SigNoz allows teams to monitor application health, latency, and errors during deployments. This level of detail helps identify and resolve issues before they affect end users, making it an essential tool for businesses committed to zero downtime.
The platform’s OpenTelemetry-based instrumentation simplifies the process of collecting telemetry data. Developers can implement monitoring without making extensive code changes, reducing the workload while enhancing observability. This makes it especially useful for teams looking to improve visibility without slowing down their deployment cycles.
SigNoz also features intuitive dashboards and alerting tools designed for quick troubleshooting. During rolling updates or canary deployments, it can immediately flag performance issues or error spikes, enabling teams to make informed decisions about whether to proceed or roll back. This proactive approach ensures smoother deployments and supports uninterrupted operations.
A mid-sized SaaS company in London showcased the power of combining these tools. By migrating to a Kubernetes-based deployment pipeline and integrating Prometheus for metrics, Zabbix for infrastructure monitoring, and SigNoz for application observability, they achieved zero downtime. Their average deployment downtime dropped from 30 minutes to none, deployment frequency increased, and user satisfaction improved. Automated rollbacks and real-time alerts enabled swift issue resolution, ensuring uninterrupted service [2][8].
| Tool | Key Strengths | Primary Use Case | Integration Benefits |
|---|---|---|---|
| Zabbix | Scalability, templates, webhook integrations | Infrastructure & application monitoring | Automated incident response, multi-environment support |
| OneUptime | Unified uptime, logs, APM | Streamlined deployment observability | Simplified dashboards, reduced tool complexity |
| SigNoz | Metrics, logs, traces, OpenTelemetry | Application-level, cloud-native workloads | Deep microservices visibility, easy instrumentation |
Need help optimizing your cloud costs?
Get expert advice on how to reduce your cloud expenses without sacrificing performance.
Building an Open-Source Observability Stack
Creating an observability stack that brings together metrics, logs, and tracing tools is essential for maintaining complete visibility into your system's health and deployment processes. The foundation of this setup relies on three primary components: metrics collection, log aggregation, and distributed tracing. When these elements are effectively integrated, they provide a clear picture of your system's performance.
To ensure smooth integration, choose tools that work well together. For instance, Prometheus is excellent for collecting metrics, while Loki or the ELK stack (Elasticsearch, Logstash, Kibana) handles logs, and Jaeger manages distributed tracing. These tools share common APIs and data formats, making integration straightforward. Here's a closer look at how these tools can work together.
Key Tools for Metrics, Logs, and Traces
At the heart of metrics collection is Prometheus, which scrapes time-series data and offers powerful querying capabilities through PromQL. When paired with Grafana, it enables the creation of dashboards that provide real-time visualisations of system performance - especially useful during deployments.
For log aggregation, you have two strong options. Loki is a lightweight solution that works seamlessly with Grafana, making it a great choice for teams already using Grafana for monitoring. On the other hand, the ELK stack offers advanced search and analysis capabilities, though it requires more resources to operate effectively.
Jaeger plays a critical role in distributed tracing, particularly in microservices architectures. It tracks request flows across services, helping teams pinpoint bottlenecks or latency issues during deployments. Additionally, Jaeger integrates with OpenTelemetry, a fast-growing standard for collecting telemetry data and instrumenting applications.
Together, these tools create a unified observability solution. Prometheus gathers metrics, Loki or the ELK stack ingests logs, and Jaeger collects trace data via OpenTelemetry. By visualising all this data in Grafana, teams gain a comprehensive view of system health during deployment.
Customising Observability for Deployment Complexity
Your observability stack should be tailored to match the size and complexity of your deployments, as well as your organisation's specific needs. Factors such as deployment scale, cloud infrastructure, and team expertise all play a role in determining the best setup.
For smaller teams with simple deployments, a lightweight stack combining Prometheus and Loki is often sufficient. This setup provides robust monitoring without unnecessary complexity, allowing teams to focus on their core applications instead of managing extensive monitoring systems.
Larger organisations with intricate microservices architectures, however, may need a more advanced approach. In such cases, the ELK stack is better suited for handling high log volumes, while Jaeger becomes indispensable for tracing requests across multiple services. These environments often require dedicated teams to manage the observability stack and the infrastructure to support it.
Cloud architecture also influences tool selection. Public cloud deployments can take advantage of managed services to simplify operations, whereas hybrid environments need tools that work across diverse infrastructures. For example, Kubernetes users might benefit from Prometheus, thanks to its built-in service discovery features.
Team expertise is another important consideration. Teams already familiar with Elasticsearch may lean towards the ELK stack, even for smaller setups. Meanwhile, those new to observability often find Prometheus and Grafana easier to adopt and maintain.
Customisation is key. Adjusting data retention policies can help control storage costs, while tuning alert thresholds reduces noise and ensures critical issues are flagged. Configurable dashboards also allow teams to focus on the metrics that matter most, supporting zero-downtime deployment goals.
| Deployment Type | Recommended Stack | Key Considerations |
|---|---|---|
| Small applications | Prometheus + Loki + Grafana | Simple to set up, minimal maintenance needed |
| Microservices architecture | Prometheus + ELK + Jaeger + Grafana | Handles large-scale logs and tracing |
| Hybrid cloud | Zabbix + Prometheus + Loki | Works across multiple environments |
To integrate observability into your CI/CD pipelines, careful planning is essential. Your tools should automatically monitor each stage of deployment, providing real-time feedback to development teams. Automated health checks can trigger rollbacks if metrics indicate issues, while detailed logs help diagnose problems quickly.
For UK businesses seeking to optimise their observability stack, Hokstad Consulting offers tailored DevOps and cloud optimisation services. Their expertise ensures your monitoring setup delivers maximum value while keeping operational costs in check.
An observability stack should evolve alongside your organisation. Start with core metrics and logs, then introduce distributed tracing as your architecture grows more complex. Regular reviews and updates will ensure your stack remains aligned with your operational goals, including zero-downtime deployments. This foundation sets the stage for the seamless deployment practices discussed in the next section.
Monitoring Best Practices During Deployments
Keeping a close eye on deployments is all about finding the right balance - covering all the bases while ensuring alerts lead to meaningful action. The goal is to spot and resolve potential issues before they snowball into bigger problems. By weaving monitoring into every stage of your deployment process, you can stay one step ahead.
Configuring Alerts and Incident Response
The first step in effective monitoring is setting up alerts that matter. Focus on key metrics like error rates, latency, and resource usage. These indicators quickly reveal if your deployment is on track or if something’s going wrong.
To avoid unnecessary distractions, use dynamic baselines. These adjust alerts to account for normal fluctuations, like higher traffic during peak business hours. Tools like Prometheus and Zabbix can help by grouping related alerts into a single notification, cutting down on redundant messages.
Assigning severity levels to alerts is another important piece of the puzzle. Critical alerts should immediately notify your on-call engineers, while lower-priority warnings can be logged for later review. This way, urgent issues get the attention they need without overwhelming your team.
Incident response should be clear and structured. Predefined runbooks and escalation policies ensure everyone knows their role when an alert is triggered. For example, automated notifications through Slack or Microsoft Teams can alert the right people instantly. If the first responder doesn’t act within five minutes, the system can escalate the issue to a backup engineer. Regularly reviewing and fine-tuning your alert rules helps maintain focus on the most pressing issues while cutting down on unnecessary noise.
These practices tie directly into your CI/CD pipeline, ensuring continuous deployment runs smoothly.
Integrating Monitoring with CI/CD Pipelines
Once you've nailed down your alerting practices, the next step is to integrate monitoring into your CI/CD pipeline. This allows you to validate each stage of the deployment process with automated checks and tests. By doing so, you can ensure that new code meets performance standards before it reaches users.
Set up your CI/CD system to perform health checks and smoke tests at every stage. Tools like Prometheus or OneUptime can provide health endpoints that your pipeline checks during deployment. These endpoints offer real-time insights into application health, database connections, and external service availability.
In 2022, a financial services firm used Zabbix and Prometheus in their CI/CD pipeline to automate health checks and vulnerability scans. This approach cut deployment-related incidents by 45% and improved mean time to recovery (MTTR) by 30% [5].
Typically, your pipeline will query these monitoring endpoints at key points. For instance, after deploying to a staging environment, it might wait for all health checks to pass before moving the release to production. If metrics show a problem, automated systems can roll back to the last stable version. Feature flags add another layer of control, allowing you to roll out new features gradually and monitor their impact. If performance dips, the feature can be disabled instantly, avoiding a full rollback.
For more complex deployment methods, like blue-green or canary releases, monitoring becomes even more critical. These strategies rely on tools to compare metrics between environments or versions, flagging any anomalies that could signal issues. The table below outlines how monitoring fits into different deployment strategies:
| Deployment Strategy | Monitoring Integration | Key Benefits |
|---|---|---|
| Blue‑Green | Separate monitoring for each environment | Spot issues before switching traffic |
| Canary | Compare metrics between canary and baseline | Detect anomalies and enable quick rollback |
| Rolling Update | Check health progressively during rollout | Validate gradually and pause if needed |
For organisations in the UK, it’s essential to comply with GDPR by using UK-based cloud regions for storing monitoring data.
If you’re looking to refine your deployment monitoring approach, Hokstad Consulting offers expert guidance in DevOps and cloud cost efficiency. Their tailored solutions help businesses achieve reliable monitoring without overspending - especially valuable for complex deployment pipelines.
Monitoring for Cost Optimisation and Scalability
Monitoring isn’t just about keeping systems up and running - it’s a smart way to cut costs and improve efficiency. Open-source monitoring tools can give you the insights needed to identify wasteful spending, fix bottlenecks, and scale resources wisely. By keeping an eye on the right metrics and tying observability data to your cloud expenses, you can save money while maintaining performance. This level of visibility not only helps avoid downtime but also uncovers areas where you can trim costs during your deployment processes.
Identifying Bottlenecks in Deployment Pipelines
Inefficiencies in deployment pipelines can quickly rack up costs. Tools like Prometheus, Grafana, and Zabbix are excellent for pinpointing these problem areas. They track build times, error rates, and resource usage, helping you see where delays happen - whether it’s slow container builds, inefficient database migrations, or under-provisioned resources [4][5]. For example, spikes in CPU usage or sluggish response times often signal bottlenecks. These tools give you real-time insights into exactly where your pipeline is struggling, allowing you to make targeted improvements [3][8].
By analysing utilisation patterns, you might notice that some virtual machines consistently show low CPU usage, which could mean they’re candidates for resource consolidation. On the other hand, memory spikes might point to sizing issues. Take the case of a tech startup that managed to reduce deployment time from six hours to just 20 minutes, slashing downtime caused by infrastructure issues by 95% in the process [1].
Linking Observability to Cloud Cost Engineering
Once bottlenecks are identified, observability data can play a huge role in saving costs by linking resource usage to cloud spending. When metrics, logs, and traces are combined, they give you a full picture for making smarter cost decisions - from spotting over-provisioned resources to fine-tuning auto-scaling policies. For instance, auto-scaling based on precise metrics like peak usage hours ensures that you’re only paying for the capacity you actually need, without compromising performance during high-traffic periods [3][4].
Insights from monitoring also make cloud cost engineering more effective. Right-sizing resources based on actual usage can lead to big savings. Companies that adopt strong monitoring and observability practices often report cutting infrastructure costs by 30–50%, with some saving over £50,000 each year [1][3]. Linking monitoring data to cloud cost dashboards creates a feedback loop, helping you connect resource usage spikes to specific deployment events. This allows for quick adjustments to prevent overspending. Balancing cost-efficiency with uninterrupted deployments is key to maintaining zero downtime.
For organisations in the UK, compliance adds another layer to cost considerations. Storing monitoring data in UK-based cloud regions ensures GDPR compliance while supporting cost-saving efforts. Plus, tracking performance metrics in pounds sterling provides clearer financial insights for better decision-making.
Monitoring also helps catch issues early - like resource saturation or memory leaks - that could drive up costs over time. Fixing these problems before they escalate not only avoids performance hiccups but also prevents costly emergency fixes [3][5].
If you want to make the most of your monitoring strategy, Hokstad Consulting can help. They specialise in turning observability data into actionable cost-saving strategies. From resource allocation to scaling policies and infrastructure tweaks, their approach ensures UK organisations get maximum value out of their open-source monitoring tools.
Conclusion: Achieving Zero Downtime Success with Open-Source Tools
Achieving zero downtime with open-source tools is not just possible - it’s practical and cost-effective. By combining observability, affordable tools, and proven best practices, you can establish a strong foundation for dependable deployments.
Take, for instance, a mid-size SaaS company running on Kubernetes. They successfully achieved zero downtime by using open-source tools like Prometheus for metrics, Grafana for visualisation, and Flagger for canary deployments [2]. This setup allowed them to monitor system health in real time, automate rollbacks, and maintain service-level objectives. The result? Increased deployment frequency and improved reliability.
Open-source tools such as Prometheus, Grafana, Zabbix, and OpenTelemetry provide flexible, customisable solutions. Their adaptability makes it easier to tailor your monitoring framework to meet UK-specific infrastructure and compliance requirements.
At the heart of zero downtime deployments lies observability - metrics, logs, and distributed tracing must be seamlessly integrated into CI/CD pipelines. This ensures issues are detected and resolved in real time [3].
Beyond reliability, cost optimisation is another major advantage. Effective monitoring practices can help cut infrastructure costs significantly. Many organisations report savings of 30–50%, with some achieving annual reductions exceeding £50,000 [1]. By identifying bottlenecks in deployment pipelines and correlating observability data with cloud expenditure, businesses can make smarter decisions about resource allocation and scaling.
For UK companies aiming to adopt these strategies, Hokstad Consulting offers bespoke monitoring and DevOps solutions. Their expertise in cloud cost engineering and DevOps transformation has helped clients reduce infrastructure-related downtime by up to 95%, enabling quicker deployments and dramatically minimising disruptions [1].
Ultimately, achieving zero downtime involves more than just deploying tools. It requires a well-rounded strategy that balances performance, costs, and reliability. Success depends on metrics, logs, and tracing working together harmoniously. With the right mix of open-source tools, thoughtful best practices, and expert guidance, your organisation can achieve seamless, efficient deployments.
FAQs
How can open-source tools like Prometheus and Grafana help ensure zero downtime during deployments?
Open-source monitoring tools like Prometheus and Grafana are essential for maintaining uninterrupted service during deployments. These tools provide real-time system performance data, allowing you to spot and resolve potential problems before they affect users.
Prometheus focuses on collecting and storing metrics, coupled with robust alerting features that notify teams of unusual behaviour. Meanwhile, Grafana takes those metrics and transforms them into visually intuitive dashboards, making it simple to monitor deployment performance and spot trends instantly.
When integrated into your DevOps pipeline, these tools enable proactive service monitoring, reduce the risk of disruptions, and help ensure a smooth user experience - even during the most complex deployments.
What are the main differences between blue-green, canary, and rolling deployments, and how does monitoring support each approach?
Blue-green, canary, and rolling deployments are popular strategies for reducing downtime and minimising risks during software updates. A key component of their success is effective monitoring, which helps catch potential problems early and ensures a smooth transition.
Blue-green deployments use two separate environments: one active (blue) and one idle (green). The new software version is deployed to the idle environment first. Once it passes all tests, traffic is redirected to the green environment. Monitoring is crucial here to confirm the green environment is stable and ready before it becomes live.
Canary deployments introduce updates gradually to a small group of users. This approach relies heavily on monitoring to evaluate performance, spot any issues, and decide whether it's safe to expand the rollout to the wider audience.
Rolling deployments update the application in phases by replacing instances one at a time. Monitoring ensures both the updated and yet-to-be-updated instances are functioning properly, maintaining system stability throughout the process.
In all these methods, real-time monitoring is indispensable for spotting anomalies, tracking performance, and ensuring users experience a smooth update process.
What skills are needed to successfully set up and manage open-source monitoring tools for zero downtime deployments?
To successfully use and manage open-source monitoring tools, it’s important to have a good grasp of DevOps practices, especially when it comes to continuous integration and deployment (CI/CD) pipelines. Being comfortable with Linux-based systems, scripting languages like Python or Bash, and configuration management tools will also give you an edge.
On top of that, understanding networking basics, system performance metrics, and troubleshooting methods will allow you to fine-tune your monitoring setup effectively. While technical skills are crucial, having a proactive approach and tailoring the tools to fit your specific environment can make all the difference in maintaining zero downtime.