Hybrid monitoring works when I treat cloud, on-premises, and the network between them as one system. If I don’t, faults at the boundary take longer to find, teams waste 20–30 minutes lining up data, and downtime can cost about £4,400 per minute.
Here’s the short version:
- I need one monitoring model before I pick tools
- I should link metrics, logs, traces, and network data
- I need clear ownership, tags, and SLOs across the whole estate
- I should keep a central view without sending every raw signal into one place
- I need to watch the network paths between cloud and on-premises, not just hosts
- I should choose managed or open-source based on team time, data residency, and spend control
- I need to run monitoring as a daily process tied to alerts, CI/CD, incidents, compliance, and cloud spend
A few numbers stand out. 66% of firms use two or three observability platforms, and 18% use four or five. That split makes cross-boundary issues harder to track. The fix is simple in principle: use the same tags, the same service rules, and the same way of handling telemetry across both sides.
If I were boiling the article down to one point, it would be this: the main issue is not the dashboard. It’s the model behind it.
OpenTelemetry: Simplifying Hybrid Cloud Monitoring
Need help optimizing your cloud costs?
Get expert advice on how to reduce your cloud expenses without sacrificing performance.
Quick comparison
| Area | What I’d focus on |
|---|---|
| Monitoring model | One shared setup for signals, ownership, and SLOs |
| Telemetry | Join metrics, logs, traces, and flow data |
| Data handling | Keep high-volume data local; send higher-value summaries centrally |
| Boundary checks | Track VPNs, gateways, DNS, BGP, TLS, and synthetic journeys |
| Tool choice | Match the stack to staffing, residency rules, and cost control |
| Daily use | Cut alert noise, link to delivery, and use the same data for audits and spend |
What follows is a clear plan for doing that without turning monitoring into a pile of tools and alerts.
Define Your Monitoring Model Before Choosing Tools
Hybrid monitoring tends to fall apart when each environment follows a different model. Before you pick tools, set one shared model for signals, ownership, and SLOs. In plain terms, decide upfront how signals are handled, who owns what, and which thresholds apply across both on-premises and cloud setups.
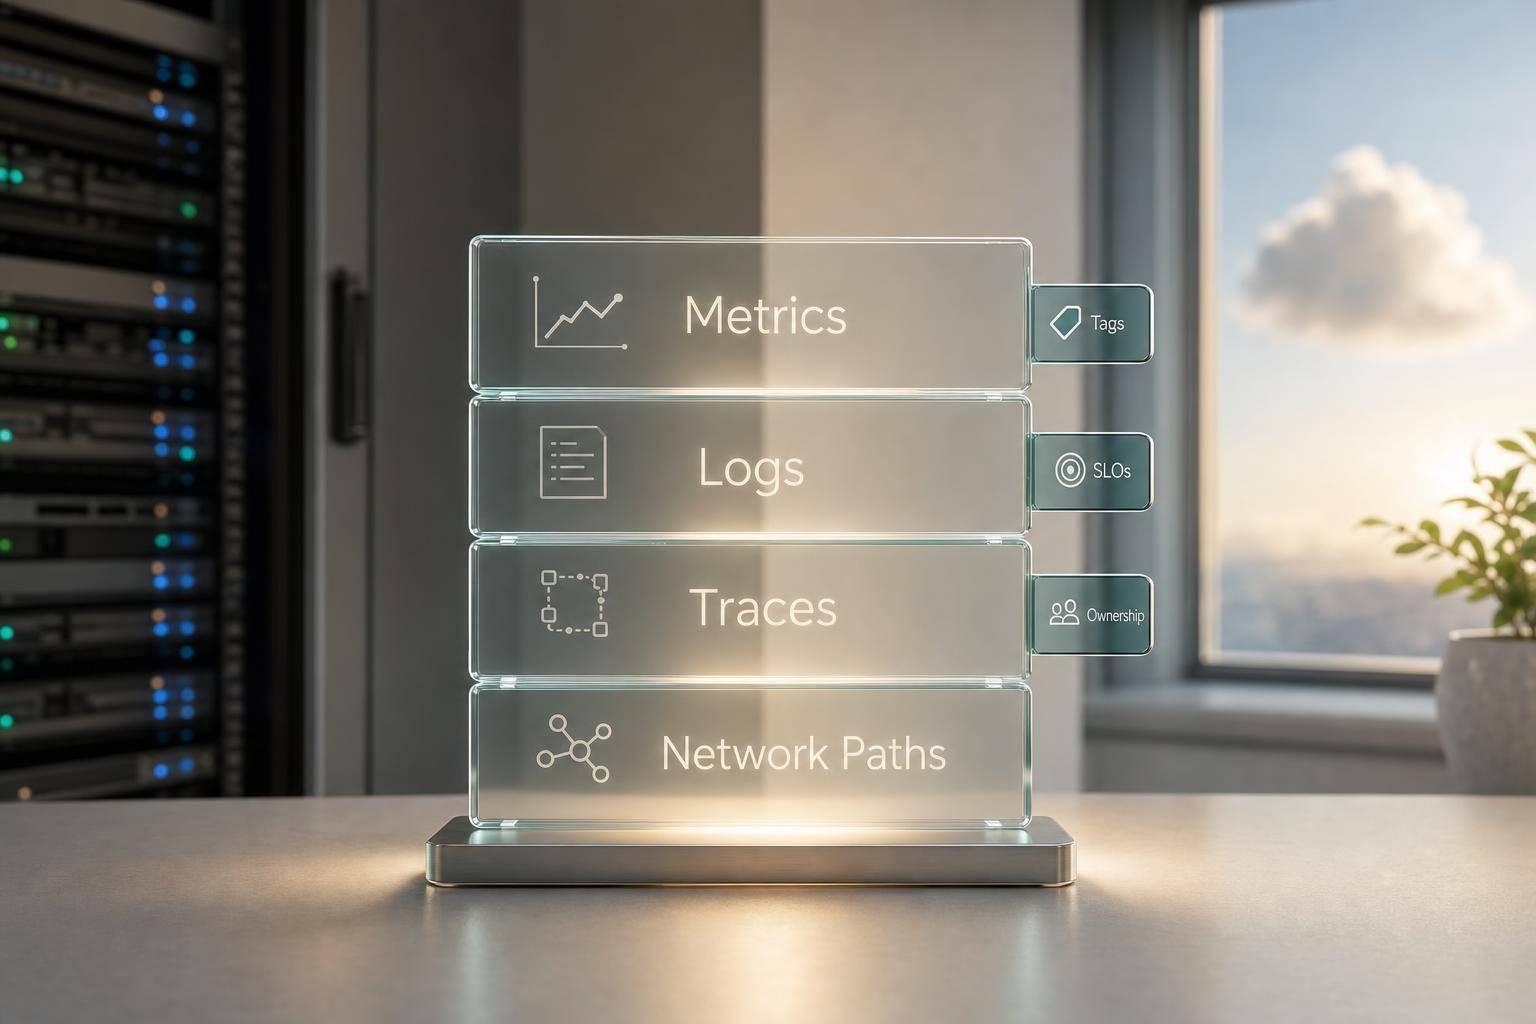
Treat Metrics, Logs, and Traces as One Observability System
Boundary problems are hard to track when signals sit in silos. Metrics, logs, and traces each show a different piece of the picture. Put them together, and you can follow an issue from a user-facing symptom right down to a service call crossing the line between your on-premises and cloud workloads.
Use one shared model across boundaries:
| Signal Type | Hybrid Challenge | Unified Solution |
|---|---|---|
| Metrics | Different definitions (EC2 vs VMware) | Normalise data so metrics live in the same query |
| Logs | High log volume | Centralise and parse for audit trails and compliance |
| Network flows | Cloud providers expose flow data differently | Combine VPC Flow Logs with on-prem NetFlow/IPFIX |
| Traces | Context lost at network boundaries | Use OpenTelemetry headers (traceparent) for continuity |
| Service topology | Manual maps go out of date | Use automated discovery for live dependency mapping |
Once those signals line up, the next step is to set clear ownership and service levels for each service.
Set Service Levels, Tags, and Ownership Rules
Set service ownership and SLOs before you build dashboards. If you skip that step, dashboards often turn into noise machines.
Tagging matters just as much, and teams often leave it too late. Tag every resource with:
- Environment
- Application
- Team/Owner
- Cost Centre
- UK Region (for data residency)
- Data Classification [1]
These tags make filtering easier and support chargeback reporting.
When you define SLOs for hybrid services, use regional targets that reflect internet routing variability. A single global threshold can look neat on paper, but it can also fire false alerts when network paths shift [5].
Build a Central View Without Losing Local Context
A central view should pull together top-level business metrics and SLOs from every environment. But that doesn’t mean dumping every raw log and high-cardinality metric into one store. That route can push up egress costs and add latency, without giving you much in return.
A tiered model works better: keep 30 days of full-fidelity logs locally for troubleshooting, 90 days of aggregates for trend analysis, and 1 year of metrics for compliance purposes [1]. Process telemetry close to the workload, then send only aggregated data that adds reporting value to the central layer.
That central layer then feeds the cross-boundary monitoring patterns in the next section.
Connect Monitoring Across Cloud, On-Premises, and Network Boundaries
::: @figure 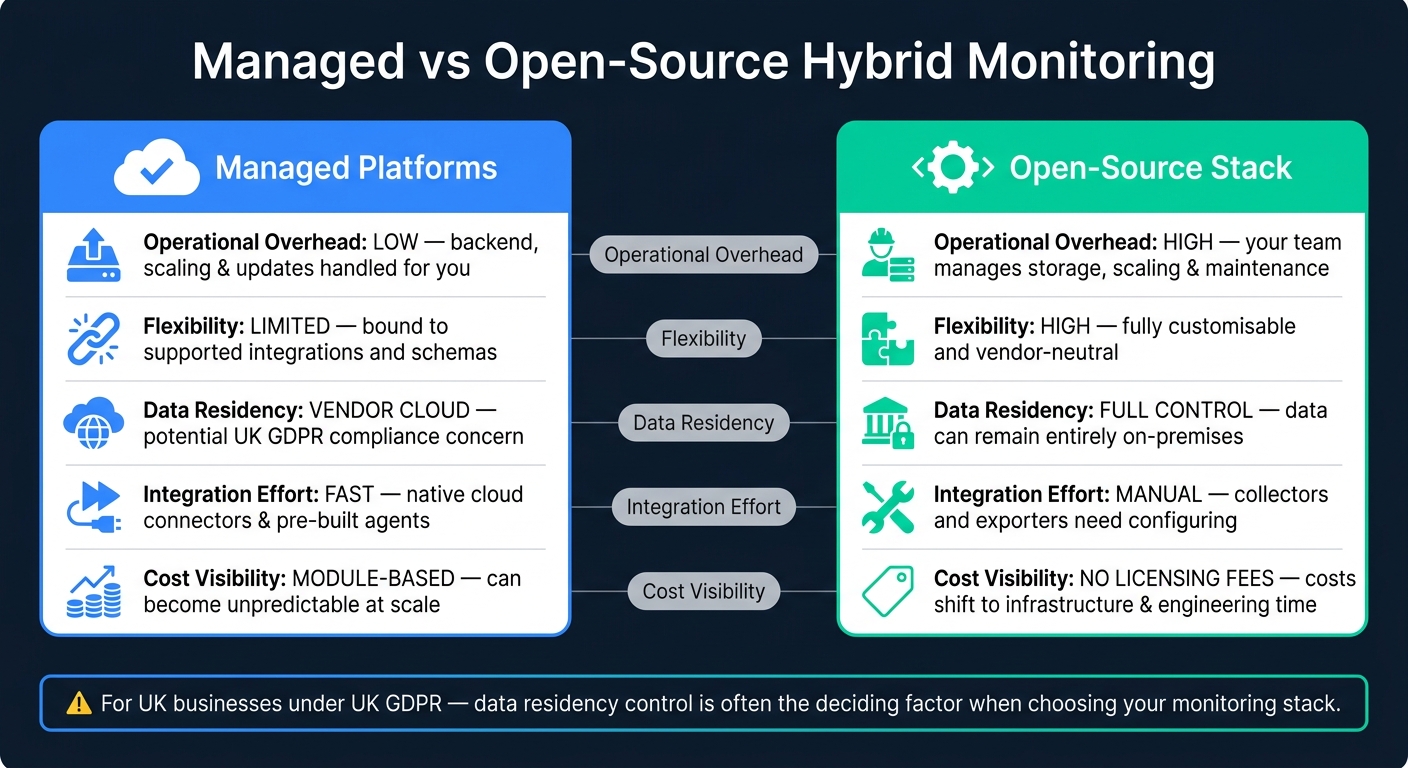 {Managed vs Open-Source Hybrid Monitoring: Key Differences at a Glance}
:::
{Managed vs Open-Source Hybrid Monitoring: Key Differences at a Glance}
:::
Once telemetry, ownership and service levels are in place, a central view only does its job if telemetry is normalised before it crosses the boundary. That’s the bit that often gets messy. You need signals from every part of a hybrid estate to feed into one clear operating view, without sending transfer and storage costs through the roof.
Bring Cloud-Native Telemetry Into Central Dashboards
Normalise native units, timestamps and severity at collection time, not after ingestion. A local collector tier can do that work before telemetry is forwarded, which keeps central dashboards cleaner and makes correlation far more consistent.
Automated dependency discovery also helps keep cross-boundary service maps up to date. That matters most when something fails right at the edge between systems [3].
Normalised telemetry makes analysis easier, but it still won’t spot every link failure on its own. If the path between services breaks, you need to watch the network path itself.
Monitor the Network Paths That Link Hybrid Services
Host metrics won’t show every boundary problem. A service can look healthy on both sides of a VPN tunnel, while users sit there dealing with timeouts caused by packet loss or a routing change halfway through the journey.
Deploy probes at interconnects, gateways and egress points to measure connection time, TLS handshakes and MTU issues [5][6]. Add synthetic transactions that follow real cross-environment workflows, because these can expose integration failures that host-level metrics simply don’t catch [5].
Keep an eye on BGP route changes and DNS resolution time as core boundary signals. It also helps to bring on-premises NetFlow or sFlow data together with cloud VPC Flow Logs in one flow analysis layer, so you can see traffic paths and volumes across the whole hybrid topology [6][1].
Managed vs Open-Source Monitoring: A Practical Comparison
Tool choice should follow operating limits, not personal taste. Pick the stack that matches team capacity, data residency needs and cost control. For UK businesses covered by UK GDPR, data residency control is often the deciding issue. Managed platforms usually store data in the vendor’s cloud infrastructure, and that can create compliance problems depending on how the information is classified [4].
| Feature | Managed platforms | Open-source stack |
|---|---|---|
| Operational overhead | Low; the backend, scaling and updates are handled for you | High; your team manages storage, scaling and maintenance |
| Flexibility | More limited to supported integrations and schemas | Highly customisable and vendor-neutral |
| Data residency | Data usually sits in the vendor's cloud, which can be a compliance concern | Full control; data can remain entirely on-premises |
| Integration effort | Fast, with native cloud connectors and pre-built agents | More manual; collectors and exporters need configuring |
| Cost visibility | Module-based pricing can become hard to predict at scale | No licensing fees, but costs shift to infrastructure and engineering time |
Open-source stacks remove licensing fees, but the spend doesn’t disappear. It moves into infrastructure and engineering time [4]. For some teams, a hybrid log federation pattern is the better fit: keep high-volume or sensitive data local, while sending higher-value signals to a central platform [7].
Run Hybrid Monitoring as a Day-to-Day Discipline
Once telemetry is centralised, the job shifts from collecting data to using it every day. Data on its own doesn’t fix anything. It starts to matter when teams use it to spot issues, make decisions, and act fast.
Cut Alert Noise with Environment-Specific Baselines
Static thresholds tend to fall apart in hybrid estates because workload patterns move around [1]. A level that looks fine on one system can be a warning sign on another. That’s why dynamic baselines matter. They learn what normal looks like over a short baseline period, then adjust thresholds to fit that pattern [2][1]. A good target is fewer than 50 actionable alerts a day [1].
Just as important, don’t treat every signal as a separate problem. If several alerts point to the same root cause, group them into one incident [1][8]. That cuts the clutter and makes it easier for teams to focus on what needs attention. It also helps to automate ticket creation and closure, so handovers don’t turn into a slow, manual chore [1].
Those baselines then feed incident correlation and automated response.
Embed Monitoring into CI/CD, Change Control, and Incident Response
Monitoring works best when it sits inside your delivery process, not off to the side. Use monitoring data to shape change control, incident response, and automated rollback. If a deployment causes trouble, the system should help you spot it straight away and react without waiting for someone to dig through dashboards.
Runbooks can restart services or roll back configuration changes when specific thresholds are breached, which cuts manual intervention [1]. In practice, that means monitoring becomes part of how software is shipped and supported, not just a tool people open after something goes wrong.
Use Monitoring Data for Compliance and Cloud Cost Control
The same telemetry used for incident response can also help with audit work and spend control.
Unified monitoring platforms can pull together cloud audit logs, such as AWS CloudTrail or Azure Activity Log, alongside on-premises syslogs to produce consolidated audit trails [2][1]. Configuration drift monitoring can also check infrastructure all the time against frameworks like CIS and SOX, flagging deviations before they turn into audit findings [1].
On the cost side, it helps to treat cloud billing data as telemetry too. Put spend metrics in the same dashboards as performance data, and it becomes much easier to spot a misconfigured auto-scaling group or a forgotten test environment before the monthly bill lands [1]. Used well, this kind of visibility can cut cloud spend by 30–60% [2].
Use one tagging scheme to tie performance, compliance, and spend together.
| Metric category | Key indicator | Business value |
|---|---|---|
| Performance | p95 latency / error rate | User experience and reliability |
| Cost | Idle resources / data egress costs | Budget control and ROI |
| Compliance | Access anomalies / audit trail gaps | Risk mitigation and legal readiness |
| Efficiency | CPU/memory saturation | Rightsizing and waste reduction |
Reuse the same tags to connect cost centres, services, and owners across the estate [1][8].
Conclusion: A Monitoring Approach That Supports Reliability, Compliance, and Cost Control
Start with the boundary map, then tie it to telemetry, ownership, and service levels [1][8]. Doing that work early helps you avoid blind spots across the hybrid estate.
Once the map is in place, the next step is to run from one shared operating model. Use the same telemetry, tagging, and data-handling model across monitoring, cost, and compliance. Where it makes sense, automate first-response workflows. Automated runbooks should deal with routine alerts before a person needs to step in [1].
That matters more than picking any one tool. The main shift is how the team works day to day: treat hybrid infrastructure as one environment, not two.
Review alert thresholds every quarter and remove stale rules that no longer point to real incidents [3][8]. Aim for fewer than 50 actionable alerts per day [1]. That helps keep hybrid monitoring lined up with reliability, compliance, and cost control.
Use the same model to keep reliability, compliance, and cloud spend in step.
FAQs
How do I start hybrid cloud monitoring?
Start with a unified strategy that pulls data from on-premises systems and public cloud environments into one dashboard. Pick a monitoring platform that can automatically discover assets across every environment.
Then connect your infrastructure with agents, agentless polling and cloud-native APIs, use consistent tagging to standardise data, and track clear KPIs such as network latency and application response times.
Which data should stay local?
For organisations with strict compliance rules, sensitive data should stay on-premises, while other metrics can be sent to the cloud.
That split gives teams a practical middle ground: keep tight control over protected data, while still using cloud-based monitoring tools for broader system metrics.
How do I reduce alert noise?
Use AIOps tools with machine learning to set dynamic baselines for normal behaviour. That makes it easier to cut false positives and mute alarms that don’t matter.
It also helps to bring monitoring into one platform, so logs, latency spikes, and flow changes can be tied to the same incident instead of showing up as a pile of separate alerts. Hokstad Consulting can help deploy these AI-driven methods to automate root cause analysis and make incident response smoother.