
If I run systems across cloud, on-premises, hosted platforms and older kit, one monitoring tool usually won’t show the full problem. That’s why incidents take longer to trace, alert noise builds up, and cloud spend drifts. In many estates, 29% of cloud spend is wasted and outage costs can pass £790,000 per month for some firms.
Here’s the short version:
- The main problem: data sits in separate tools, so I can see symptoms but miss the link between cause and impact.
- What breaks first: service names, tags, timestamps and traces don’t line up across platforms.
- What that leads to: more manual work, more false alerts, and more storage cost from 50 GB to 200 GB of logs per day.
- What fixes it: one telemetry layer, one tagging model, custom dashboards, service maps, sampling, and alert rules based on service health.
- What to do first: start with business-critical services, set clear SLIs, version configs with code, and scrub sensitive data before it leaves private systems.
- What the pay-off looks like: lower observability spend, fewer noisy alerts, and incident diagnosis that takes less time. Some teams cut costs by 30–50% over three years.
I’d put it like this: monitoring tells me something broke. Observability helps me see why it broke, even when the issue starts in one place and shows up somewhere else.
That’s the core idea behind this article.
::: @figure 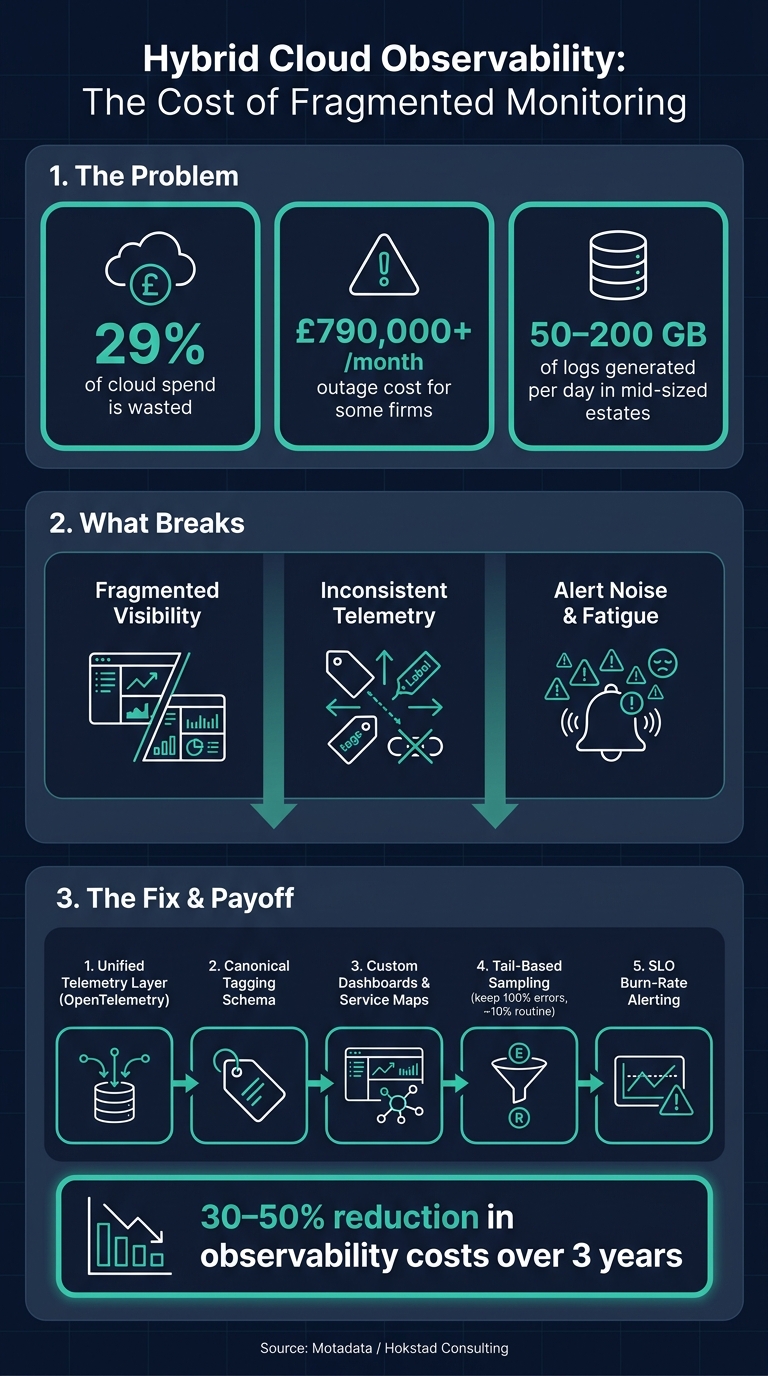 {Hybrid Cloud Observability: Key Stats & Cost Impact}
:::
{Hybrid Cloud Observability: Key Stats & Cost Impact}
:::
OpenTelemetry: Simplifying Hybrid Cloud Monitoring
The core problems in hybrid cloud observability
Hybrid estates tend to fall apart for one simple reason: no single tool sees the whole estate. Each platform may work fine on its own, but incident data starts to fail when it crosses from one environment to another. In practice, that shows up in three main ways: fragmented visibility, inconsistent telemetry, and alert noise.
Fragmented visibility across tools and environments
Separate dashboards hide the links between cloud, on-premises and hosted systems. So teams end up chasing symptoms instead of the root cause. A tool might be spot on inside its own boundary, but incidents rarely stay neatly inside one environment.
This is where visibility gaps hit hardest. A saturated on-premises firewall can slow down a cloud-hosted checkout service, but if those two parts are watched in separate tools, neither side shows the link. The team then burns time looking at the cloud service while the actual fault sits on-premises, out of sight.
And even if data is pulled into one place, root-cause analysis can still stall when the telemetry doesn’t match.
Inconsistent telemetry and hard-to-trace dependencies
Bringing data together is only half the job. The harder part is that the data often doesn’t line up. Different environments use different tagging rules, timestamp formats and naming schemes. A service called checkout-api in one platform might show up as checkout_api_prod in another. During a live incident, nobody wants to spend time matching those by hand.
The problem gets worse when legacy systems sit alongside cloud-native services. Older infrastructure often doesn’t emit structured traces, so automated dependency mapping falls over at the exact point where teams need it most. Without a clear view of how services connect, correlation becomes manual, diagnosis slows down, and outage costs climb. The share of organisations losing more than £790,000 per month to outages has risen from 43% to 51% [5].
That leads straight to the last problem: too much data and too many alerts.
High data volume, rising costs and alert noise
A mid-sized hybrid estate can generate 50 GB to 200 GB of logs a day [2]. Without filtering or tiering, all of that data gets stored at full fidelity. Before long, observability spend can get close to hosting spend [6].
The biggest cost trap in hybrid monitoring is keeping all logs at full fidelity for a year because nobody had the meeting about tiering.- Jagdish Sajnani, Senior Content Strategist, Motadata [2]
The money issue is only part of it. Alert noise adds a human cost as well. When engineers have to work through hundreds of alerts in a shift, fatigue kicks in fast. Important signals get buried. Response times slip. And the people best placed to fix the issue end up sorting noise instead of fixing the incident.
A unified observability layer can cut costs by 30–50% over three years [2], but that only happens when teams tighten retention and clean up alerting.
How custom observability solves these problems
Generic monitoring tools tend to assume a neat, standard setup. Most estates aren't like that. Custom observability takes a different route: it builds telemetry around how your estate actually works. That means shaping pipelines, service maps, dashboards and alerts to fit the systems you run, not forcing your systems to fit a tool. Put simply, the answer is to build observability around the estate, not around individual tools.
A unified telemetry layer built on open standards
A vendor-neutral instrumentation framework like OpenTelemetry (OTel) at the application layer lets teams instrument once and keep the backend flexible without recoding [4]. That matters because backend choices change. Rewriting instrumentation every time is a pain no one wants.
It also helps to define one canonical tagging taxonomy before deployment, so the same service name appears in Kubernetes, tracing and the CMDB [4]. If one system calls a service payments-api and another calls it payment-service, correlation gets messy fast.
A clean setup follows a three-plane model:
- Collection: agents and SDKs at the source
- Processing: collectors that filter, enrich and route
- Consumption: dashboards, alerting and SIEM tools [4]
The processing tier is where telemetry gets enriched and routed in a consistent way. Collectors can automatically attach infrastructure context - cluster name, cloud region, node type - to every span, so developers do not have to tag code by hand [4].
Once telemetry is standardised, teams can bring the right context into incident views.
Custom dashboards, service maps and correlation logic
Standardised telemetry only helps when it appears in a form that matches how teams work day to day. A custom dashboard is not just a nicer screen. It's a deliberate choice about what an engineer needs to see during an incident, so teams can trace incidents across environments faster.
Service maps show how assets and service paths depend on each other, which makes it much easier to spot when a change in one environment has affected another [1]. Add deployment markers - version labels injected into traces and metrics at every release - and teams can tell the difference between a code regression and an infrastructure fault more quickly [3].
There is also the issue of cloud and platform differences. One provider's metric names may not line up with another's. Normalising provider-specific metrics into one SLI model, such as database write acknowledgement time
, lets teams compare providers directly without doing manual translation each time [4].
Cost-aware pipelines and smarter alerting
Once the data model is consistent, the next step is to cut volume and noise at ingestion. Tail-based sampling is one of the best ways to do that: keep 100% of traces for errors and slow requests, but sample only around 10% of routine traffic [4]. You still keep the detail that matters, while storage and egress costs stay under control.
Alerting also improves when it reflects service behaviour instead of crude thresholds. SLO burn-rate alerts using short and long windows are much more reliable than simple threshold rules. They catch sudden failures and slow degradation without firing on brief transient spikes, which cuts alert fatigue and helps teams diagnose issues faster [3].
Collectors can also scrub PII and secrets before telemetry leaves the private network boundary [4]. That gives teams a cleaner path to share observability data without letting sensitive data slip through.
Need help optimizing your cloud costs?
Get expert advice on how to reduce your cloud expenses without sacrificing performance.
Implementing custom monitoring in a UK hybrid estate
Once your telemetry is standardised, the next move is to roll it out in stages. Think of hybrid observability as a phased rollout: begin with the services that matter most, standardise telemetry, and then expand.
Start with business-critical services and clear SLIs
After you’ve got volume and alert noise under control, focus first on the services that have the biggest impact on the business. Before you instrument anything, set one tagging schema that works across both on-premises and cloud assets - service, environment, owner and criticality [2].
That sounds simple, but it saves a lot of grief later. If teams tag systems in different ways, dashboards get messy, alerts become harder to route, and reporting turns into a manual chore.
Embed observability into DevOps, security and change management
Observability works best when it becomes part of your day-to-day DevOps and change management process. Version dashboards, alerts and collector configs alongside the services they support, so changes stay tied to the code and systems they affect.
On the security side, use RBAC for dashboards and redact sensitive data before telemetry leaves the workload boundary [4]. That makes data flows easier to govern and matters even more for UK organisations dealing with personal data.
Where Hokstad Consulting can help
Hokstad Consulting can design the observability architecture, build custom integrations, and keep telemetry pipelines cost-aware from the start.
Conclusion: Better visibility, faster diagnosis and tighter cost control
Hybrid cloud observability starts to break down when tools are split across teams, telemetry isn’t consistent, and data volume grows without control. Those gaps slow diagnosis and push spend up. The answer is a custom observability layer built around the way your estate actually runs. Custom observability solves this by standardising telemetry and controlling data volume at the source.
The best outcomes come when monitoring matches your architecture, your priorities and your budget. Done well, that approach can cut monitoring costs by 30–50% over three years [2] and help teams diagnose issues faster. That’s why phased implementation is the practical next step.
Standardise your taxonomy, instrument once, and route telemetry to the tools that need it. Hokstad Consulting can help design and build a cost-aware observability foundation aligned to your business.
FAQs
How is observability different from monitoring?
Monitoring tracks set metrics and alerts teams when thresholds are crossed. That helps surface the symptoms of possible issues.
Observability goes deeper. It gives teams end-to-end visibility into why problems happen. By connecting logs, metrics and traces, it helps teams find root causes across complex, interconnected systems.
Which services should I instrument first?
Start with the services that have the biggest impact on user experience and the business paths that matter most. First, work out the key operational questions your team should be able to answer within five minutes. For example, which service is burning through error budgets the fastest? Where is latency starting to climb?
From there, focus on metrics, logs, and traces so you can get a clear picture of performance and service dependencies across your hybrid setup. OpenTelemetry can help standardise data across cloud and on-premises systems.
How can I reduce log costs without losing visibility?
Reduce log costs by filtering data at the source and auditing your telemetry pipeline so you cut unnecessary logs before they hit costly platforms.
It also helps to use tiered storage for older data, downsample metrics where that makes sense, and lean on compact metrics for day-to-day monitoring. Save high-volume logs mostly for root-cause analysis, when you need the extra detail.
Hokstad Consulting can help restructure this approach, spot inefficiencies, and cut observability spend.