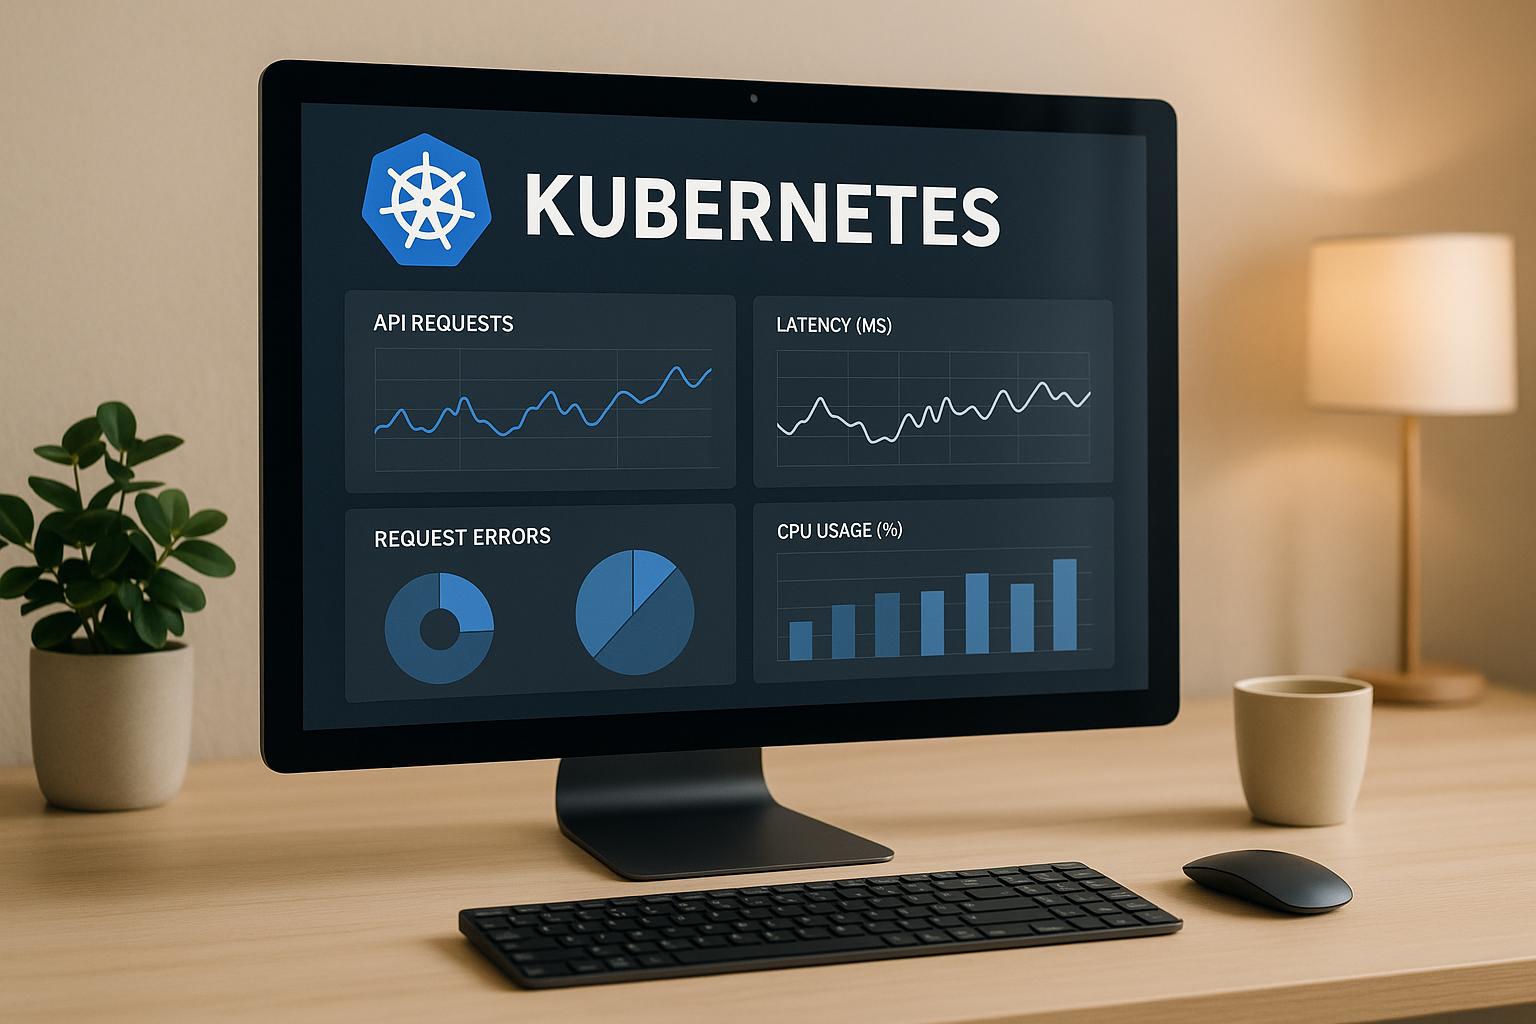
The Kubernetes API server is the backbone of your cluster, handling all interactions and operations. Monitoring its performance is crucial to maintaining cluster health and avoiding disruptions. Here's what you need to know:
- Why Monitor? Performance issues in the API server can lead to slow deployments, failed requests, or downtime. Tracking metrics like latency, error rates, and resource usage helps prevent these problems.
- Key Metrics to Watch: Focus on request latency (
<100ms), throughput, error rates (<0.1%), and etcd performance (e.g., request durations, disk sync times). - Tools to Use: Prometheus and Grafana are widely used for collecting and visualising metrics. Add-ons like kube-state-metrics and Calico can provide deeper insights.
- Best Practices: Regularly review monitoring data, fine-tune alerts, and optimise resource allocations. Use autoscaling tools like HPA and VPA to manage workloads efficiently.
Monitoring helps you avoid costly downtime, improve scalability, and maintain a responsive infrastructure. Set up your metrics collection, configure tools, and establish alerting systems to stay ahead of potential issues.
Kubernetes Cluster Monitoring for beginners
Understanding the Kubernetes API Server's Role
The Kubernetes API server acts as the central hub of your cluster, orchestrating every interaction within the Kubernetes environment. As the Kubernetes documentation puts it:
The Kubernetes API lets you query and manipulate the state of objects in Kubernetes. The core of Kubernetes' control plane is the API server and the HTTP API that it exposes. Users, the different parts of your cluster, and external components all communicate with one another through the API server.[2]
This makes the API server an indispensable component for maintaining cluster health. Every action - whether deploying applications, scaling workloads, or troubleshooting - passes through this key system. Gaining a clear understanding of its role is crucial for identifying the metrics that ensure smooth and reliable performance.
What Does the API Server Do?
The API server handles several vital responsibilities to keep the cluster running efficiently. It validates and configures data for all API objects, such as pods, services, and replication controllers [3]. Essentially, every REST operation you initiate is processed through the API server, which serves as the frontend to the cluster's shared state [3].
One unique aspect of the API server is its exclusive connection to etcd, the cluster's data store. Other components - like kubelet, kube-proxy, kube-scheduler, and kube-controller-manager - must communicate with etcd through the API server [4][5][6].
Another important function is the API server's ability to handle real-time notifications through its watch functionality. This enables clients to receive updates instantly when resources are created, modified, or deleted [5]. This feature ensures consistency across the cluster and allows components to react quickly to changes.
These core responsibilities highlight why monitoring the API server is critical for maintaining overall cluster performance.
Why Performance Monitoring Matters
Any performance issues with the API server can ripple across your entire infrastructure. Bottlenecks in the API server can lead to slow deployments, failed requests, and even downtime [10]. Since every operation in the cluster relies on this component, even a slight slowdown can have a significant impact on business operations.
The stakes are high. Poor API server performance can result in failed deployments and unresponsive workloads, making troubleshooting a time-consuming and costly endeavour [8]. For businesses that depend on fast deployment cycles, these issues can directly affect revenue and productivity.
Recent advancements have shown how optimising the API server can yield substantial benefits. For example, scalability tests on 5,000-node clusters revealed that enabling consistent reads from cache reduced kube-apiserver CPU usage by 30%, etcd CPU usage by 25%, and cut the 99th percentile pod LIST request latency by up to threefold [7]. These improvements demonstrate the value of targeted optimisations in boosting cluster performance.
The API server's watch cache functionality is typically refreshed within 110ms in 99.9% of cases [9]. However, without proper monitoring, this performance can degrade over time. Tracking metrics like request latency, error rates, and resource usage allows you to detect and address issues before they affect your applications.
Given its central role, maintaining API server stability is a top priority for Kubernetes administrators [8]. Without effective monitoring, it’s impossible to detect performance problems early enough to prevent service disruptions.
Understanding these core principles underscores why monitoring the API server isn't just a best practice - it’s essential for keeping Kubernetes operations reliable. The next step is to explore the specific metrics that reveal the health and performance of the API server.
Key Performance Metrics to Monitor
Keeping a close eye on the API server's metrics is crucial for maintaining its health and ensuring smooth operations. By monitoring the right metrics, you can identify potential issues early, address bottlenecks, and plan for capacity adjustments - all of which help keep your cluster responsive and reliable.
Observing the metrics of kube-apiserver will let you detect and troubleshoot latency, errors and validate that the service performs as expected.[10]
Metrics can be grouped into three main categories: request patterns, resource consumption, and backend storage performance. Each offers valuable insights into different aspects of the API server's functioning. Let’s dive into these metrics, starting with those that directly influence user interactions.
Request Latency and Throughput
Request latency and throughput are key indicators of how well the API server handles incoming requests. These metrics directly impact user experience and application performance.
apiserver_request_duration_seconds_bucket: This metric tracks request latency in seconds, using a histogram to measure response times across various percentiles [10]. High or increasing latencies can signal performance issues or availability concerns [1]. Ideally, latency should stay below 100 ms, as exceeding this threshold can degrade performance significantly [11].apiserver_request_total: This metric counts the total number of requests received by the API server, breaking them down by origin, target component, and success or failure status [10]. Analysing HTTP responses (2xx, 4xx, 5xx) can help pinpoint bottlenecks [1].rest_client_request_duration_seconds_bucket: This metric measures the latency of API calls made by components like kube-controller-manager and kubelet [10].
| Metric | What It Measures | Ideal Range |
|---|---|---|
| Latency | Response delay (ms) | < 100 ms |
| Throughput | Requests per second (RPS) | Scales with traffic |
| Error Rate | Percentage of failed requests | < 0.1% |
| Availability | Uptime percentage | > 99.9% |
Resource Usage
Monitoring resource usage ensures the API server has enough capacity to handle varying loads. For example:
-
process_cpu_seconds_total: Tracks total CPU time consumed by the API server [10].
High CPU or memory usage can signal inefficiencies or potential capacity issues. Sudden spikes in memory usage may indicate memory leaks or inefficiencies that could lead to crashes or degraded performance. This is especially important considering that API-related problems cost 43% of companies over £1 million per month [11].
etcd Performance and Availability
Since the API server relies on etcd for data storage, monitoring etcd's performance is just as critical. Its responsiveness directly affects the API server's reliability.
-
etcd_request_duration_seconds_bucket: Measures the latency of API requests between kube-apiserver and etcd [10].
Additional etcd-specific metrics to track include:
-
etcd_disk_wal_fsync_duration_seconds: Should remain below 10 ms; higher values indicate disk performance issues that could slow the cluster [13]. -
etcd_disk_backend_commit_duration_seconds: Tracks the time required to persist changes to disk. Significant increases over a short period should be investigated [12]. -
etcd_mvcc_db_total_size_in_bytes: Monitors the database size. Alerts should be set if usage exceeds 80% of the configured maximum [12]. -
etcd_network_peer_round_trip_time_seconds: Detects network issues between etcd nodes [12]. -
etcd_server_leader_changes_seen_total: Tracks leadership changes in the etcd cluster. A high rate of changes may indicate infrastructure problems [12]. -
etcd_server_proposals_failed_total: Highlights failed proposals, often due to network issues between etcd nodes [12]. -
etcd_debugging_store_watchersandetcd_debugging_mvcc_slow_watcher_total: Help identify if the kube-apiserver is struggling to process events efficiently [12].
Tools for Monitoring
Monitoring Kubernetes effectively requires tools that not only gather data but also present it in a way that helps you address issues quickly. These tools convert raw metrics into actionable insights, bridging the gap between identifying problems and resolving them.
Over time, Kubernetes monitoring tools have evolved significantly, with Prometheus standing out as a go-to solution for monitoring and alerting in Kubernetes environments [14]. When paired with Grafana for visualisation and network monitoring components, you get a well-rounded approach to tracking your API server's performance.
Prometheus and Grafana
Prometheus forms the backbone of most Kubernetes monitoring setups. This open-source tool collects metrics using a pull-based approach. Its built-in Kubernetes service discovery simplifies the monitoring process by automatically detecting and tracking new services as they are deployed [17].
On the other hand, Grafana is an observability platform that works seamlessly with Prometheus. It supports various data sources, including Prometheus databases, and is widely used to create dashboards that visualise Kubernetes metrics [17]. Together, these tools allow users to design custom dashboards and gain deeper insights into Kubernetes performance.
To deploy both tools, you can use the kube-prometheus-stack Helm chart. This package sets up a complete Prometheus stack within your Kubernetes cluster [17]. Alongside Prometheus and Grafana, it includes Node-Exporter, Kube-State-Metrics, and Alertmanager, providing all the components needed for comprehensive monitoring.
Once Grafana is configured with the Prometheus URL (typically http://localhost:9090/) [18], you can either build your own dashboards or use pre-built ones tailored for Kubernetes environments. For instance, the Kubernetes / Compute Resources / Cluster
dashboard is a popular choice for tracking resource utilisation [17].
For businesses seeking to cut down on operational overhead, Grafana Cloud offers a free tier that includes 10,000 active series metric storage [15]. This option reduces infrastructure costs while delivering professional-grade monitoring capabilities.
kube-state-metrics
Kube-state-metrics (KSM) focuses on providing insights into Kubernetes objects, such as deployments, nodes, and pods [19]. Unlike other tools that primarily track resource usage, KSM exposes raw data from the Kubernetes API, enabling users to perform their own analysis [19].
KSM is particularly useful for understanding the health and performance of applications and workloads from a cluster-wide perspective. It stores a snapshot of the Kubernetes state in memory, offering a detailed view of object states across your cluster.
To ensure smooth performance, allocate about 250MiB of memory and 0.1 cores for KSM [19]. For larger setups, KSM supports horizontal sharding with the --shard and --total-shards flags, and daemonset sharding for distributing pod metrics monitoring.
When deploying KSM, it's better to configure a specific Prometheus scrape setup rather than relying on annotation-based discovery. Using the --use-apiserver-cache flag can also help reduce latency and lower the load on etcd, which benefits your API server directly.
Calico for Network Monitoring
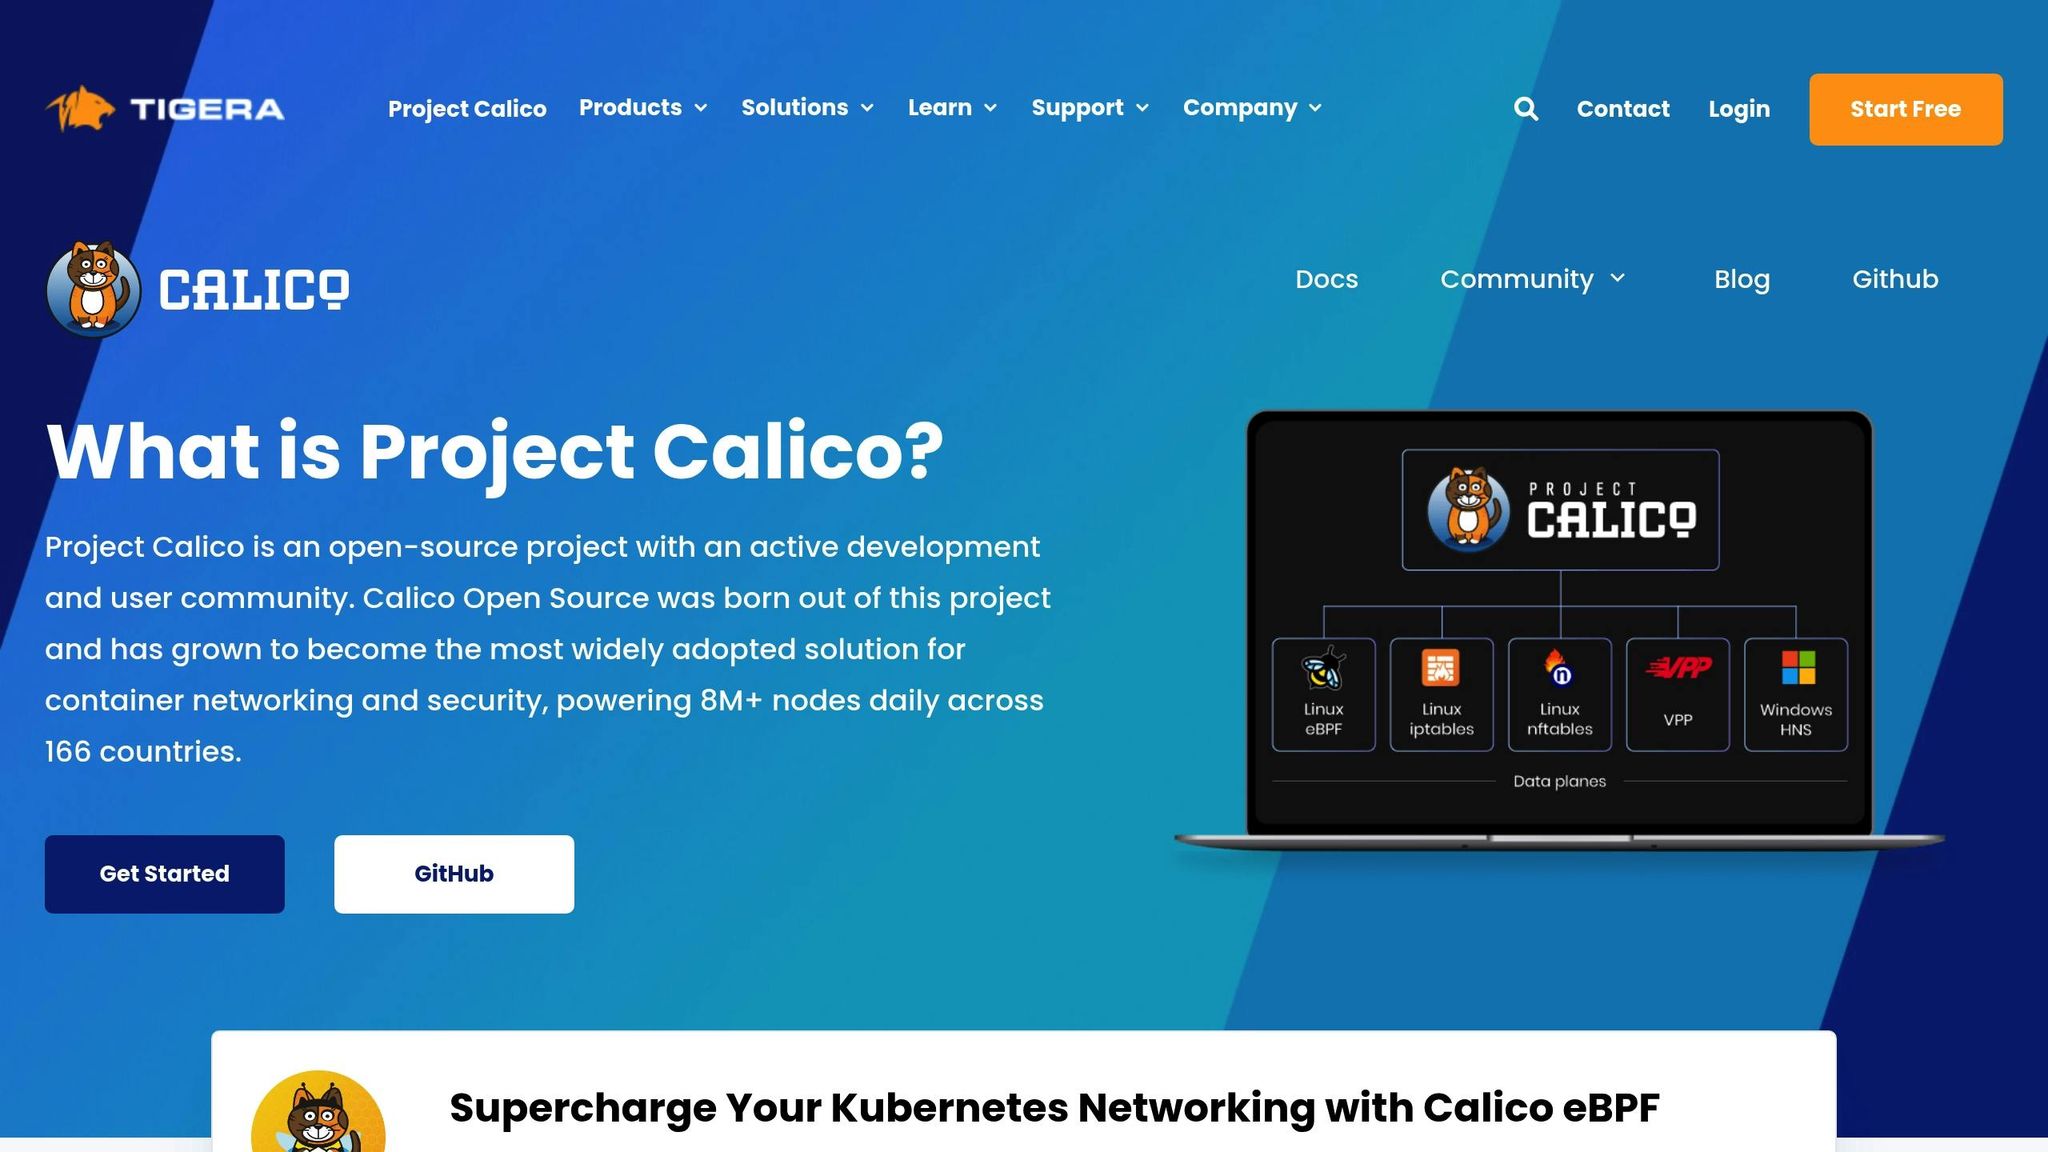
Calico extends monitoring to the network layer, which has a direct impact on API server responsiveness. As one of the most widely adopted tools for Kubernetes networking and security, Calico is a reliable choice for production environments [14].
From a monitoring perspective, Calico gathers metrics related to network activity, policies, and nodes. This includes tracking HTTP requests, DNS queries, and TLS connections [14]. These metrics complement API server monitoring by showing how network performance influences cluster operations.
To set up Calico monitoring, configure Calico nodes to export metrics to Prometheus by enabling the prometheusMetricsPort
parameter in the configuration file [20]. These metrics can then be integrated into Prometheus or added as a data source in Grafana [14].
Grafana Cloud provides multiple ways to send Prometheus metrics from Calico, including agentless scrape jobs, the Grafana Agent scraping service, and Prometheus remote write [15]. This flexibility allows you to choose an approach that fits your existing setup.
For added security, you can use network policies to restrict access to Calico metrics endpoints [16]. If Prometheus metrics aren’t required, you can disable Prometheus ports altogether [16].
Need help optimizing your cloud costs?
Get expert advice on how to reduce your cloud expenses without sacrificing performance.
Set Up API Server Monitoring
To monitor your API server effectively, you'll need to enable metrics collection, configure your monitoring stack, and establish a reliable alerting system.
Enable Metrics Endpoint
The Kubernetes API server comes with a built-in metrics endpoint, so you won't need additional exporters [1]. You can access this endpoint through the cluster's internal HTTPS ports. To ensure secure access, create a ServiceAccount with a ClusterRole that grants permission to retrieve metrics [21].
For components like the kube-controller-manager, kube-proxy, kube-scheduler, and kubelet, which don’t expose metrics by default, you can enable their metrics endpoints using the --bind-address flag [21]. Once enabled, test the connection from within a cluster pod using tools like curl or wget. Make sure to validate SSL using the CA certificate (ca.crt) and an authentication token. After confirming access, configure your monitoring tools (e.g., Prometheus) to scrape the metrics endpoint by adding a job to your Prometheus configuration. This setup lays the groundwork for integrating Prometheus and Grafana into your monitoring environment.
Configure Prometheus and Grafana
With the metrics endpoint enabled, the next step is deploying and configuring your monitoring stack. Prometheus will handle metrics collection and storage, while Grafana provides the visualisation tools to analyse performance trends.
To deploy the stack, add the Prometheus community repository to Helm and install the kube-prometheus-stack. Customise the configuration with environment-specific values, such as exposing Prometheus and Grafana via NodePorts for external access [22]. Then, set Prometheus as Grafana's data source (e.g., http://prometheus-server:9090) and use pre-built dashboards designed for API server metrics. Adjust refresh intervals and time ranges based on your monitoring needs. With metrics flowing into your system and visualised in Grafana, the next step is to configure alerting rules to catch issues early.
Set Up Alerting Rules
Alerting is key to identifying and addressing problems before they escalate. Design alerts based on symptoms like high latency, frequent pod restarts, or resource exhaustion. Use the metrics you've collected to create alerts that activate when specific thresholds are breached. For example, you can monitor nodes, pods, and namespaces with dynamic thresholds to reduce false positives. Group alerts by severity and use the for parameter to ensure alerts are triggered only when an issue persists.
Here’s an example of an alert for frequent pod restarts:
groups:
- name: PodRestarts
  rules:
  - alert: PodRestarting
    expr: increase(kube_pod_container_status_restarts_total{namespace="<namespace>"}[5m]) > 3
    labels:
      severity: warning
    annotations:
      summary: "Pod {{ $labels.pod }} (namespace {{ $labels.namespace }}) is restarting frequently"
      description: "Pod {{ $labels.pod }} in namespace {{ $labels.namespace }} has restarted more than 3 times in the last 5 minutes"
And another for detecting pods terminated due to OOMKilled errors:
groups:
- name: OOMKilled
  rules:
  - alert: OOMKilledPod
    expr: rate(kube_pod_container_status_last_terminated_reason{reason="OOMKilled", namespace="<namespace>"}[5m]) > 0
    labels:
      severity: critical
    annotations:
      summary: "Pod {{ $labels.pod }} (namespace {{ $labels.namespace }}) was OOMKilled"
      description: "Pod {{ $labels.pod }} in namespace {{ $labels.namespace }} was terminated due to OOMKilled"
Thoroughly test all alerting rules in a non-production environment to ensure they work as expected. Once verified, configure notification channels in Grafana or Alertmanager to route alerts to the right teams promptly.
For more detailed guidance on Kubernetes performance monitoring, visit Hokstad Consulting.
Best Practices for Ongoing Management
Keeping your monitoring system effective over time requires consistent maintenance and fine-tuning. These practices ensure you're making the most of your investment in monitoring tools.
Regular Monitoring and Alert Reviews
Monitoring systems aren’t a set it and forget it
solution. Set aside time each month to review your monitoring data and evaluate the performance of your alerts. This helps avoid alert fatigue while ensuring real issues are identified promptly.
Take a close look at resource usage to adjust allocations and save costs. For example, discussions around optimising resource limits or consolidating underused nodes can lead to significant savings without compromising application performance. These changes should be carefully evaluated and planned collaboratively [24].
Focus on the metrics that directly impact your workload rather than tracking everything [23]. For instance, if you're managing an e-commerce platform, you might analyse Prometheus metrics to review how well your Horizontal Pod Autoscaler (HPA) responded to traffic surges. If you notice delays in scaling during spikes, it might be time to adjust pod resource limits or tweak auto-scaling thresholds. Metrics like CPU usage and request rates can also reveal where improvements are needed [24].
Regularly test your alerts to ensure thresholds remain accurate and relevant [23]. These proactive reviews not only improve scaling but also help keep costs under control.
Scaling and Resource Management
Scaling strategies are essential to ensure your infrastructure keeps pace with demand. With 68% of organisations reporting rising Kubernetes costs, and half seeing increases of over 20% annually, efficient scaling is more important than ever [27]. Alarmingly, over 65% of Kubernetes workloads use less than half of their requested resources, leading to wasted cloud spending - about 32% on average [27].
A layered autoscaling approach can help mitigate these challenges. Use the Horizontal Pod Autoscaler (HPA) to adjust pod replicas based on real-time metrics, while the Vertical Pod Autoscaler (VPA) fine-tunes CPU and memory allocations within pods [27]. For cluster-level scaling, tools like Cluster Autoscaler and Karpenter can manage node counts. While Cluster Autoscaler operates reactively, Karpenter offers a more proactive and flexible approach [27].
Define specific resource requests and limits to avoid resource contention and ensure fair scheduling [26]. Resource quotas can further help manage workloads and prevent overuse. As Kenn Hussey, VP of Engineering at Ambassador, highlights:
API scalability is an architectural imperative today. Creating reusable APIs requires intentional design and empathy with the customer in mind.[28]
Before deploying changes to production, test your infrastructure in staging environments to identify potential issues. Regularly audit these settings to prevent configuration drift [25].
Regular Audits and Cost Management
Periodic audits of your monitoring setup and cluster performance can uncover inefficiencies and opportunities for improvement. These reviews are crucial for managing costs and predicting spending patterns more accurately [30].
Granular tracking of resource consumption - enabled by detailed tagging - allows for cost allocation by namespace, deployment, or service. This is especially important in multi-tenant environments [30]. Set cost anomaly thresholds based on historical data and organisational goals to catch unexpected spikes in expenses [30].
Use insights from monitoring data to fine-tune resource allocation, scaling, and application performance [32]. Right-sizing instances and leveraging Kubernetes autoscaling features can significantly reduce unnecessary expenses. As noted by Azure documentation:
Requests and limits that are higher than actual usage can result in overprovisioned workloads and wasted resources[31].
Take advantage of cloud-specific cost-saving options. For example, Azure Reservations can offer up to 72% discounts on committed VMs, while GKE Spot VMs can reduce costs by as much as 91% [31]. On the control plane side, Amazon EKS charges about £0.08 per hour, while AKS has no control plane fees [31].
If your organisation needs expert advice, Hokstad Consulting provides tailored solutions for cloud cost engineering and DevOps. Their expertise can be especially beneficial for complex Kubernetes environments or multi-cloud strategies.
Finally, regular audits of Kubernetes logs can help speed up incident response [29]. With the Kubernetes market projected to grow to £7.6 billion by 2031, at a 23.4% annual growth rate, investing in robust cost management and monitoring practices is becoming increasingly essential [33]. These efforts ensure your infrastructure remains efficient, scalable, and cost-effective.
Conclusion: Maintaining Reliable Kubernetes Operations
Keeping an eye on your API server is essential for maintaining efficient and cost-conscious Kubernetes operations. With clusters often growing to thousands of nodes and hundreds of thousands of pods [34], precise monitoring becomes even more critical as your infrastructure scales.
Good monitoring practices do more than ensure smooth operations - they can also help you manage costs effectively. By using cost-monitoring tools, organisations can significantly cut down on infrastructure expenses [35][36]. As Apptio wisely puts it:
You can't optimise what you can't see.[36]
To make the most of your metric analysis, focus on proactive strategies like autoscaling and resource allocation. Dive into API traffic data and utilise API Priority and Fairness (APF) to navigate periods of high demand [34]. These metrics can guide adjustments to autoscaling policies and resource sizing, helping to minimise throttling and unnecessary spending [34][35].
As your Kubernetes environment evolves, continuous monitoring is your ally in keeping everything running smoothly. Regularly upgrade your Kubernetes clusters to the latest version [34], and ensure your monitoring tools can handle increasing scale. For system node pools, consider using the Standard_D16ds_v5 SKU or a comparable VM SKU with ephemeral OS disks [34], and keep a close watch on their performance using your established metrics.
FAQs
What happens if you don’t monitor the performance of the Kubernetes API server?
Not keeping an eye on the Kubernetes API server can cause major performance hiccups that could destabilise your cluster. Issues like latency, errors, or resource overloads might slip under the radar, leading to slow workloads, failed deployments, and applications that just don’t respond.
When the API server struggles, it can trigger network lags, resource bottlenecks, and even security risks - all of which undermine the reliability and efficiency of your Kubernetes setup. By monitoring it regularly, you can spot these problems early, ensuring your operations run smoothly and your infrastructure stays secure.
How do I use Prometheus and Grafana to monitor Kubernetes API server performance?
To keep an eye on how your Kubernetes API server is performing, you can use Prometheus and Grafana. First, deploy Prometheus to gather metrics from the API server and other components in your cluster. Next, set up Grafana to visualise these metrics by connecting it to Prometheus as a data source. You can then create or import dashboards specifically designed to track Kubernetes performance.
Most people use Helm charts to streamline the installation process. Once everything is up and running, you’ll have access to real-time metrics, the ability to configure alerts, and tools to dig deeper into your API server's performance. This makes it much easier to spot and resolve any potential issues before they escalate.
How can I optimise resource usage and minimise cloud costs in a Kubernetes environment?
To make the most of your resources and keep cloud expenses in check within a Kubernetes setup, it's essential to configure resource requests and limits for your workloads. This approach prevents over-provisioning while ensuring resources are distributed effectively.
Take advantage of autoscaling tools like horizontal pod autoscaling and cluster autoscaling. These features allow your system to adjust resource allocation dynamically, scaling up or down based on actual demand. This way, you only pay for what you need, avoiding unnecessary costs.
Keep a close eye on resource usage through regular monitoring. By analysing consumption patterns and fine-tuning configurations, you can maintain peak performance while keeping your budget under control. Continuous oversight is key to spotting inefficiencies and making adjustments as needed.
