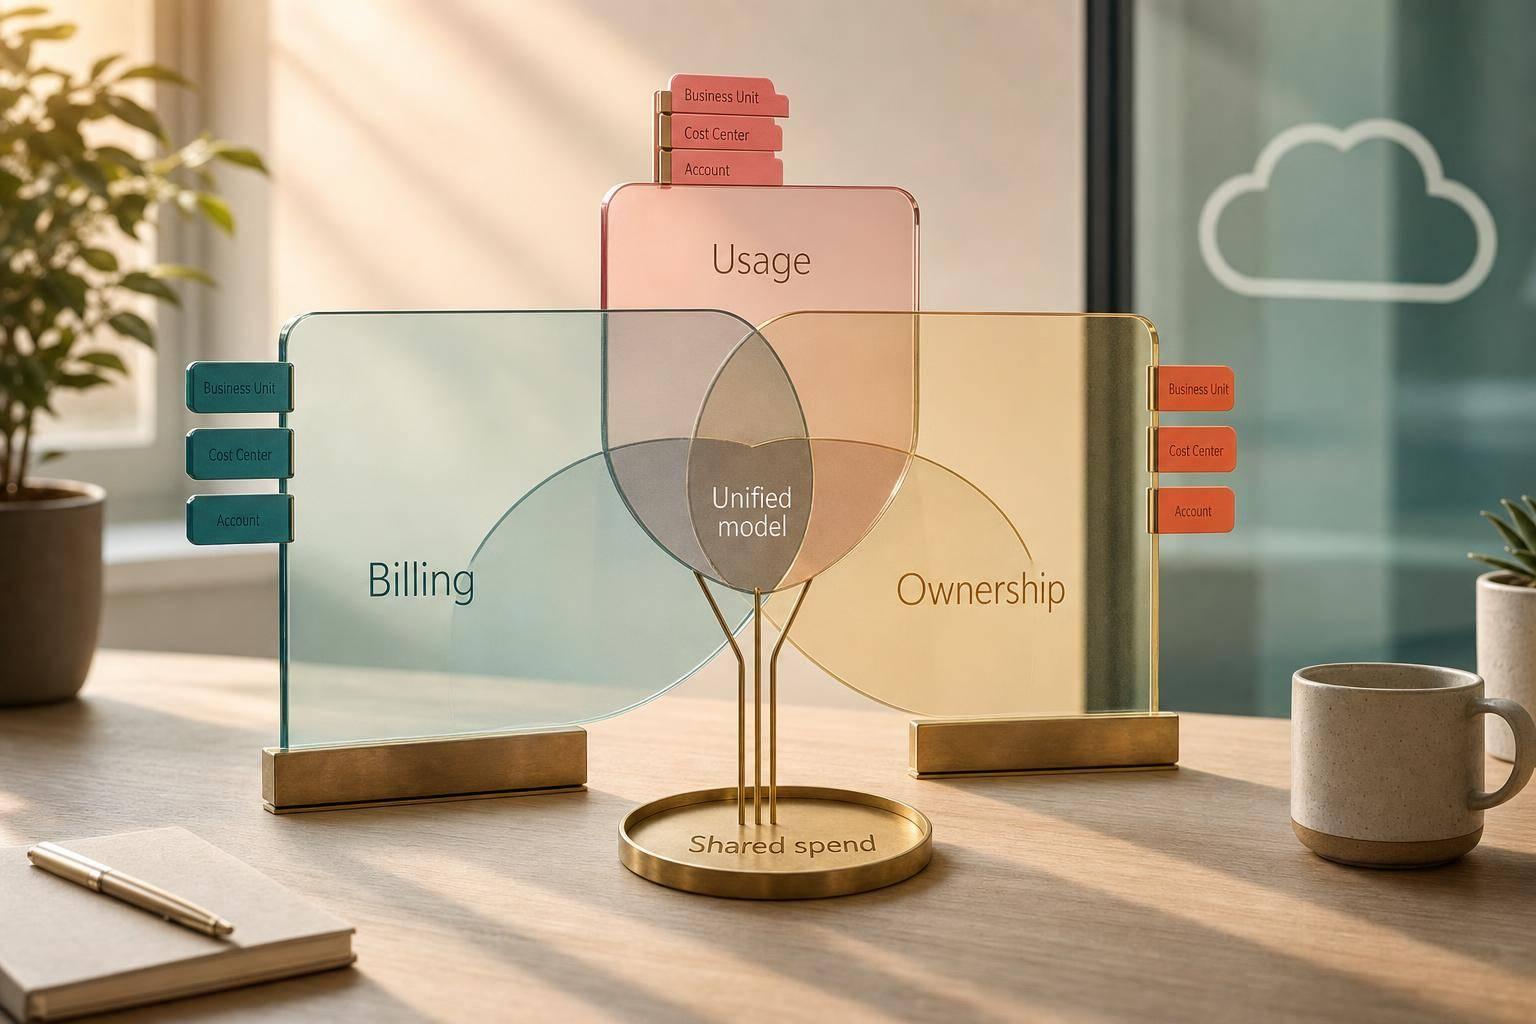
If you can’t line up cloud, on-premises and Kubernetes costs in one view, your monthly IT spend is probably off.
I’d boil this down to four points: data is split across tools, shared costs often have no owner, cloud and on-premises use different cost rules, and weak tagging leaves gaps. The fix is also plain: use one cost model, enforce ownership tags, split shared spend with clear rules, and review the numbers every month.
A few figures stand out straight away:
- 12–18% of total cost in hybrid estates can come from duplicate tools and unallocated spend
- 49% of teams said Kubernetes pushed cloud spend up because of overprovisioning and sprawl
- A good target is >90% tag coverage
- Unallocated spend should stay below 5%
- Forecast variance should stay within ±5%
If I were explaining this in one line, it would be: hybrid cloud cost monitoring fails when finance data, usage data and ownership data do not match.
Here’s the short version of what matters:
- One schema: put public cloud, private infrastructure, hosted services and on-premises costs into the same model
- Clear ownership: require
owner,cost_centerandenvironmenton resources - Shared cost rules: split items like network, observability and platform spend using agreed methods
- Showback or chargeback: give teams a direct view of what they use and what it costs in £
- Monthly checks: track tag coverage, unallocated spend, cost recovery and forecast accuracy
| Problem | What goes wrong | What to do |
|---|---|---|
| Fragmented data | Bills and usage records do not match across systems | Normalise all cost data into one model |
| Weak allocation | Tags are missing and shared spend has no owner | Enforce labels and set allocation rules |
| Mixed pricing models | Cloud and on-premises costs are hard to compare | Use fully loaded unit costs in £ |
| Cost drift | New services appear and reporting falls behind | Automate checks and review monthly |
So if you want cleaner reporting, tighter forecasting and fewer month-end surprises, start with one question: can you show every major infrastructure cost, in £, with a clear owner?
::: @figure 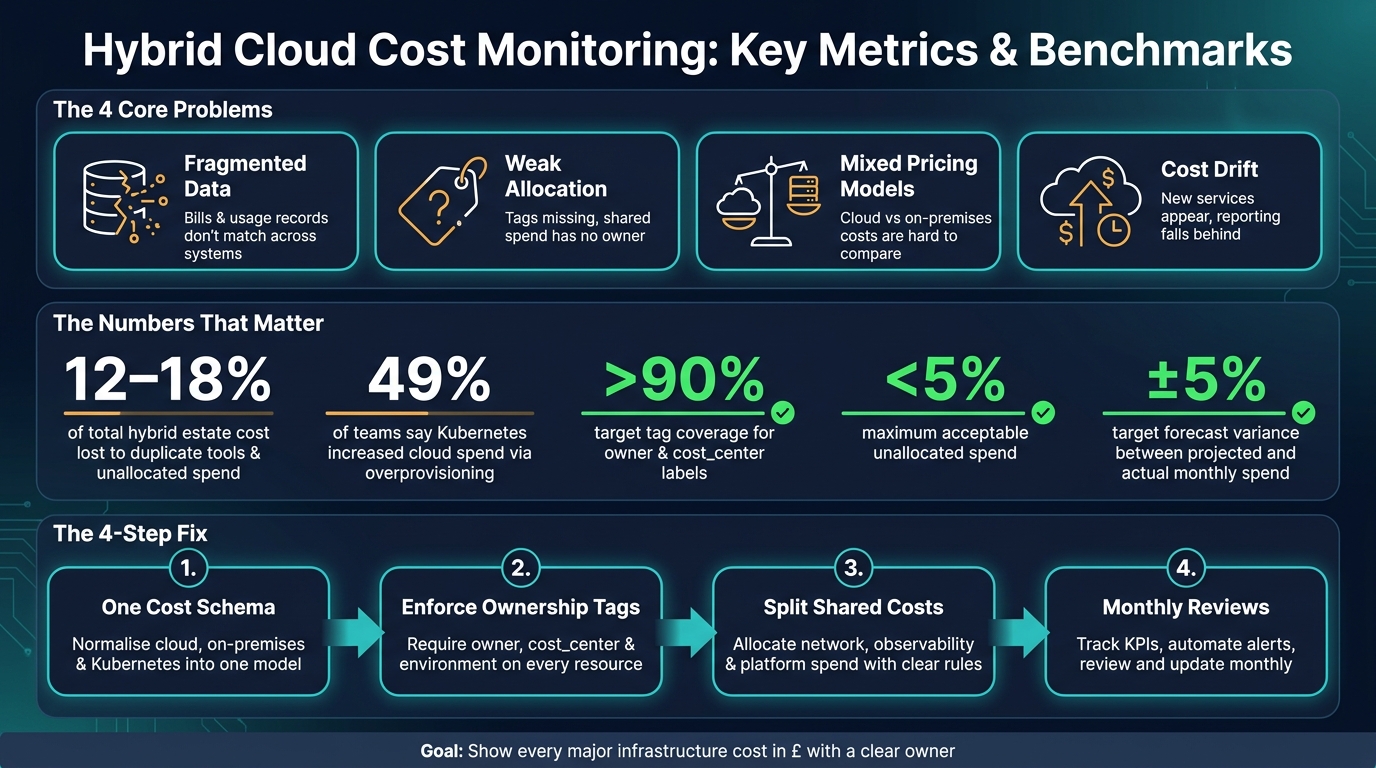 {Hybrid Cloud Cost Monitoring: Key Metrics & Benchmarks}
:::
{Hybrid Cloud Cost Monitoring: Key Metrics & Benchmarks}
:::
The main problems in hybrid cloud cost monitoring
Fragmented data across cloud, on-premises and Kubernetes
The core issue is incompatibility. Each platform exports cost data in a different format. Public cloud providers all structure billing data differently. On-premises costs, meanwhile, are often buried in spreadsheets under hardware depreciation, power, rack space and hypervisor licensing. Until those sources are normalised, side-by-side comparison just doesn’t work.
Kubernetes adds another layer of mess. Nodes are billable, but the pods running on them are short-lived. Namespaces often stretch across multiple apps and teams, so the cost of one workload can vanish the moment that workload finishes. What’s left is unattributed spend.
This isn’t some edge case. 49% of teams said Kubernetes increased their cloud spend because of overprovisioning and sprawl [2]. When the data is split across systems and the workloads keep moving, a single cost view is out of reach without normalisation.
Poor cost allocation from weak tags and shared resources
Tags and labels are usually the main way to assign cloud costs to teams, products or business units. In practice, though, they break down all the time. Developers launch test environments without tagging them. Older on-premises workflows were built long before modern tagging policies existed. Bit by bit, a chunk of spend ends up with no clear owner.
Shared infrastructure makes things harder. Costs tied to NAT gateways, cross-availability-zone traffic, platform observability stacks and Kubernetes control planes support many teams at once, but they rarely come with a clear allocation key. So finance often carries those costs centrally instead of assigning them properly.
Without ownership, cost reporting turns into bookkeeping. It may record spend, but it doesn’t give teams much control over it.
How different pricing models make comparisons unreliable
On-premises and cloud costs follow different financial models, so direct comparison is rarely clean. Public cloud charges by the second or hour, with variable fees for egress, API calls and managed services. On-premises spend is tied to capital expenditure cycles that usually run for three to five years, with power, facilities and support contracts spread over long amortisation periods.
That can make side-by-side cost checks misleading. A workload that looks cheaper in the cloud may simply be leaving out egress charges. For UK teams, there’s extra friction on top: supplier charges often need converting into £, and reporting needs to line up with the UK fiscal year, which runs from 6 April to 5 April.
Public cloud costs move with usage. On-premises costs sit inside long depreciation cycles and are allocated more slowly, with less detail.
Discount commitments add another wrinkle. They’re often managed separately from the teams running the workloads. If workloads move between regions or providers, those fixed commitments can turn into unused commitments, which then distort the true cost of running a service [2]. That’s why hybrid cost monitoring needs one shared model instead of separate reports.
Practical solutions for a single, usable cost view
Build one cost data model across all environments
Use one cost schema across all estates. Instead of running separate reports for public cloud, private infrastructure, on-premises infrastructure and Kubernetes, bring each environment into a single schema.
The goal is simple: roll spend up by service, team and environment, then work out fully loaded unit costs per workload, transaction or user. That gives you a fair way to compare cloud and on-premises economics [3].
One part that often gets missed is on-premises infrastructure. Power, cooling, floor space and staff overhead are often left out, which can make on-premises look cheaper than it is when set against cloud environments [3]. If the source data is messy or uneven, the whole model starts to wobble.
Enforce tagging, labelling and ownership standards
For Kubernetes, labels and namespace ownership should link costs to the team or service that owns them [1].
Older on-premises systems can be harder to tag cleanly. In those cases, a Configuration Management Database (CMDB) can close the gap by mapping resources to owners through automated discovery and relationship lookups [1].
Shared costs also need a clear split. If nobody agrees on the rules, every cost review turns into an argument.
| Shared Resource Type | Allocation Method |
|---|---|
| Network/Security | Consumed bandwidth or device count |
| Central platforms | Active users, ticket volume or API calls |
| On-Premises Overhead | Power, rack space and hardware depreciation |
| Cross-Team Projects | Proportional weighting or fixed percentage |
Once ownership is clear, you can show each team what it is using and what that use costs.
Use showback or chargeback to make teams accountable
After costs are allocated, the next step is deciding how to use that data. Showback and chargeback are the two main options, and the better fit depends on how far your organisation has come with cost control.
Showback is often the best place to start. It gives teams visibility without hitting them with an immediate budget penalty. Chargeback, where teams are billed for what they use, tends to fit organisations that already have strong budget control. For many companies, a hybrid model lands in the middle and works well.
| Model | Effort | Fairness | Behavioural Impact | Finance Suitability |
|---|---|---|---|---|
| Showback | Low | Moderate | Awareness and visibility | Reporting and analysis |
| Chargeback | High | High | Direct accountability | Budgeting and recovery |
| Hybrid | Moderate | High | Balanced responsibility | Enterprise-wide planning |
These allocations need automation and regular checks to stay accurate. Without that, even a good model drifts over time.
Hybrid Cloud Costs Key Problems to Solve
Tooling, automation and governance that keep monitoring accurate
Once your allocation rules are set, governance is what keeps them honest. A cost model is only useful while the data behind it stays up to date. Without a routine, things drift. Teams change services, spin up new resources, retire old ones, and before long the numbers stop lining up.
Automation helps keep that from happening. A fixed review rhythm does the same job from another angle.
Automate data collection, policy checks and cost alerts
Automate cost data collection and normalisation across public cloud, private infrastructure and Kubernetes, then feed everything into one reporting layer. That gives you one place to check spend instead of jumping between tools and exports.
Run policy checks at provisioning too. Require owner, cost_center and environment tags on every resource, and block deployment if they are missing [1]. It’s a simple rule, but it saves a lot of cleanup later. Pair this with cost alerts so unusual spend gets flagged early, before it turns into a month-end surprise.
Set a small number of KPIs and a monthly review cycle
Track a small set of KPIs and use them in monthly reviews. The goal isn’t to measure everything. It’s to spot drift early, before finance finds it first.
| KPI | Target Benchmark |
|---|---|
| Tag coverage | >90% of resources with valid owner and cost_center tags [1]
|
| Unallocated spend | <5% of total costs with no mapped owner or service [1] |
| Cost recovery ratio | >95% of shared spend reallocated to teams [1] |
| Forecast accuracy | ±5% variance between projected and actual monthly spend [1] |
Review the model every month and update it for drift, new billing data and changes in on-premises utilisation [1].
When specialist consulting can speed up results
If internal teams are stretched, Hokstad Consulting can help put the cost model, automation and governance in place so hybrid cost monitoring stays accurate over time.
Conclusion: the shortest path to better hybrid cloud cost control
Once governance is in place, the pattern is pretty clear: hybrid cloud cost control breaks down when data sits in silos and no one clearly owns it.
Start by standardising how cost data is collected and normalised. Enforce tagging at provisioning, so every resource has an owner before it reaches production. Then use showback or chargeback to give teams a plain view of what they’re spending in £. After that, automate the checks that keep the data clean over time.
That leads to cleaner reporting, tighter forecasts, and faster decisions. In many hybrid estates, duplicate tools and unallocated spend make up 12–18% of total costs [1].
If your organisation needs help, Hokstad Consulting can build the cost model, automation, and governance needed to keep monitoring accurate.
FAQs
How do we build one cost view across cloud, on-premises and Kubernetes?
Create a data collection layer that pulls billing data from cloud, on-premises and Kubernetes sources, then normalises it into one format.
Next, map everything to shared cost categories and apply consistent tagging or CMDB-based ownership. That way, you’re not comparing apples with oranges across different systems.
Then feed the normalised data into a single dashboard, such as Grafana, to give teams one clear view of costs across your hybrid estate.
What should we do when shared costs have no clear owner?
Use proportional allocation. Split costs based on measurable usage, like a team’s share of total compute usage or request volume. That gives you a firmer basis than dividing costs equally or not assigning them at all.
Write down the allocation logic clearly so everyone can see how the numbers were worked out and so you can head off internal disputes. If a tool is used across multiple cloud providers, assign costs at platform level first, then use the same method across shared services.
Which KPIs matter most for hybrid cloud cost monitoring?
Focus on KPIs that tie cloud spend to business results, including total cost of ownership, resource use, and unit economics.
Track vCPU, memory, network throughput, and disk activity alongside cost per customer or transaction. Also watch untagged resource percentages and multi-threshold budget alerts. These numbers help you spot underused assets, sharpen cost allocation, and stay on top of spend before it drifts.