
Serverless costs usually drop when I do five things well: right-size memory, cut wasted invocations, trim payload and network overhead, control log and platform spend, and review costs on a set cadence. For stateless workloads, that work is easier because each request stands on its own and cost per transaction is easier to track.
Here’s the short version:
- Measure unit cost first: I track cost per API call or transaction, p95/p99 duration, memory headroom, cold starts, and retry volume.
- Fix memory and timeouts: Many Lambda functions are given more memory than they use, and that can add £10,000s per year in waste.
- Cut invocation count: Batching, trigger filtering, and removing duplicate schedules can trim requests and log volume fast.
- Stop hidden platform spend: Logs, gateways, and data transfer can make up up to 78% of a serverless bill.
- Put guardrails in place: Budget alerts, tagging, concurrency caps, and pipeline checks help stop cost drift.
A few numbers stand out:
- 65% of AWS Lambda functions are over-allocated on memory
- HTTP API Gateway can cut request cost by 71%
- NAT Gateway data processing costs $0.045 per GB
- CloudWatch log retention costs $0.03 per GB per month
- Step Functions Express pricing starts at $0.000025 per transition
If I had to boil the article down to one line, it would be this: serverless cost control is mostly about doing less work per request, running fewer requests, and watching the services around the function just as closely as the function itself.
The rest of the piece turns that into a checklist you can use in day-to-day engineering work.
::: @figure 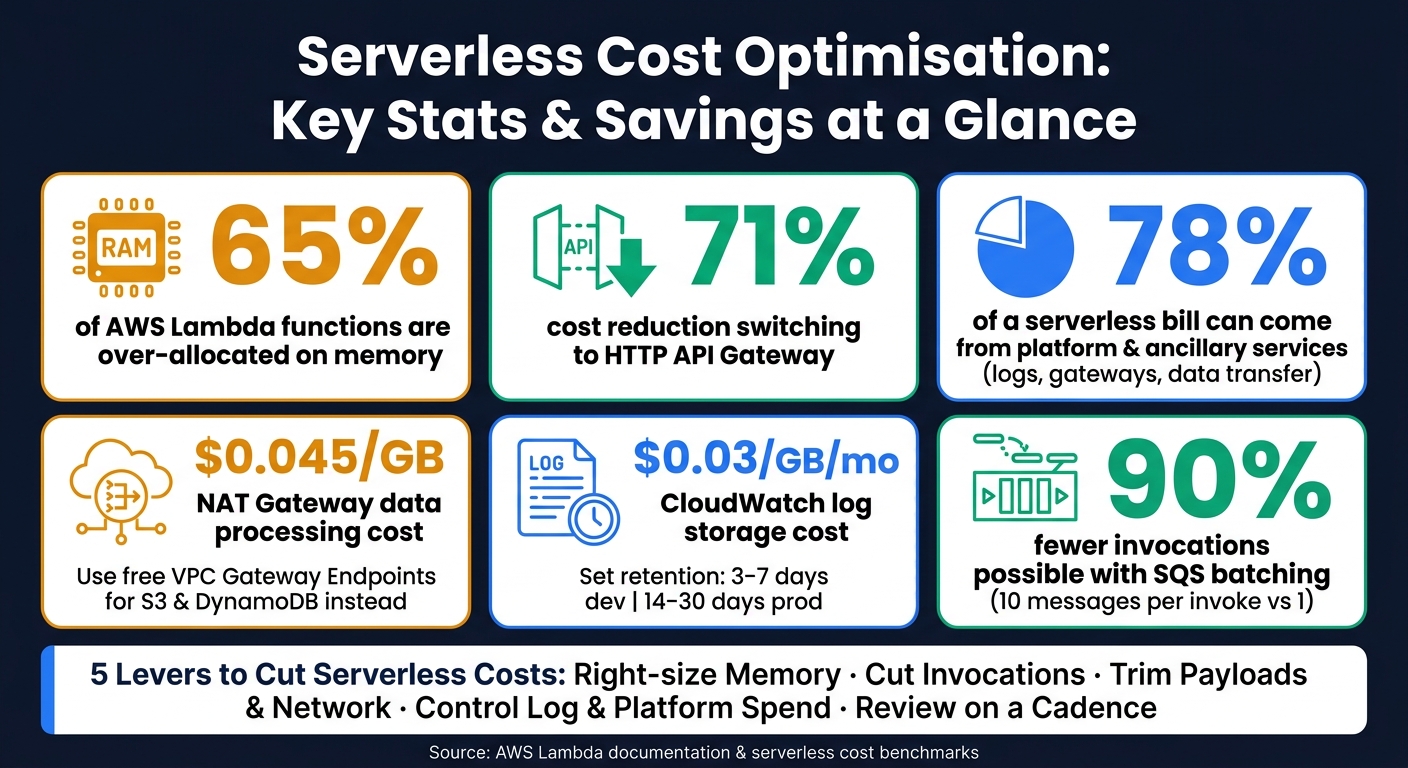 {Serverless Cost Optimisation: Key Stats & Savings at a Glance}
:::
{Serverless Cost Optimisation: Key Stats & Savings at a Glance}
:::
AWS Lambda Cost Optimization | Serverless Office Hours
Need help optimizing your cloud costs?
Get expert advice on how to reduce your cloud expenses without sacrificing performance.
2. Checklist: right-size functions, memory and execution time
Memory over-allocation is still the fastest win.
2.1 Measure usage before changing settings
Before you change anything, measure what each function is doing in practice. Track p50, p95 and p99 latency, peak memory use and cold-start frequency for every function with tools such as AWS Lambda Power Tuning or CloudWatch Lambda Insights [5][6]. The p99 figure matters most when you set safe timeout values later.
Use those baselines to choose the lowest-cost memory setting, runtime and dependency profile that still does the job.
2.2 Tune memory, runtime and dependencies
Right-size memory, runtime and dependencies to cut billed duration.
On AWS Lambda and GCP Cloud Functions (2nd gen), CPU power scales in line with memory allocation [5][6]. AWS Lambda gives you one full vCPU at 1,769 MB; below that point, a function gets only part of a vCPU [5]. That means a CPU-bound task can end up cheaper at a higher memory setting if the run time drops enough.
AWS Lambda Power Tuning helps you compare memory settings and spot the best cost/performance balance for each function. If it suits your workload, move functions to ARM-based Graviton2 processors. They can deliver up to 19% better performance at 20% lower cost than x86 [5]. For runtimes, pick options with lower cold-start and start-up overhead. Also trim unused dependencies and heavy libraries, because larger deployment packages slow initialisation.
Initialise database clients and SDK connections in the global scope, outside the handler, so warm invocations can reuse them [5][8]. Keep persistent state in external stores, such as a cache, database or queue, instead of inside the function itself.
Then put limits on runtime and retries, so failures don't keep adding to the bill.
2.3 Set timeouts and retries to avoid wasted spend
Use p99 latency and retry volume as your guide. Set each function's timeout to about 1.5× to 3× its p99 execution duration, then add a small buffer [6][7]. Default or maximum timeouts, such as 15 minutes on Lambda and 10 minutes on Azure Functions Consumption, can turn a stuck downstream service into a money drain [5][6][7].
Timeouts are only part of it. You should also set maximum_retry_attempts and maximum_event_age_in_seconds on event sources. Without those limits, failed events can keep triggering billable runs. That's how you get a retry storm: more invocations, more spend, and no extra result [5].
Pair that with a circuit breaker pattern. After 3–5 consecutive failures, stop calling the downstream service instead of letting functions sit there, waiting and racking up charges for a service that's already down [2].
3. Checklist: reduce invocation volume and redesign event flow
Getting memory and timeouts right is only half the job. The other half is making sure you’re not firing functions more often than needed.
3.1 Remove chatty triggers and duplicate schedules
Start by checking scheduled functions and other event sources for duplicate or unnecessary invocations. Every extra trigger adds request charges, more logs, and more downstream calls. If two triggers do the same job, cut one.
Also look closely at routing or transformation Lambdas that do little more than pass data from A to B. Those are prime candidates for direct service integrations, like EventBridge Pipes or Step Functions direct SDK integrations [3]. Swap them out, and you remove compute cost for those steps altogether.
Once you’ve cleared out duplicate triggers, batch the events that are left. That brings invocation count down even more.
3.2 Use batching and concurrency controls carefully
Batching is one of the simplest ways to trim invocation count, log volume, and per-request cost. If one invocation processes 10 SQS messages instead of one, invocation count can drop by up to 90%. That also cuts per-request overhead and reduces cold-start frequency [5][2].
It helps to pair batching with trigger-level filtering. EventBridge Pipes and SQS filter criteria can drop irrelevant events before they ever touch your function [3]. That means fewer invocations for work you never needed to do in the first place.
On concurrency, reserved concurrency gives you a hard cap on simultaneous executions. If traffic spikes or retries start piling up, that cap stops the system from spinning up thousands of parallel invocations [2]. Think of it as a cost guardrail, but also a way to stop things from getting messy.
And if your function handles sources with at-least-once delivery, add idempotency keys. Otherwise, the same event can be processed more than once [1][9].
After cutting invocations, the next job is to cut the amount of work inside each one.
3.3 Cut payload, network and integration overhead
Large payloads cost more than people expect. Instead of passing big data blobs between services, store the object in S3 and pass only the object key in the event. That’s the reference pattern [3][2]. Smaller payloads also mean less parsing, less network transfer, and lower billed duration.
For file uploads, S3 pre-signed URLs are often the better path. The client uploads straight to storage, so Lambda stays out of the middle entirely [9].
Network layout matters too. NAT Gateway data processing costs $0.045 per GB [5], and that can stack up fast in high-throughput pipelines. Free Gateway VPC endpoints for S3 and DynamoDB are a much cheaper route. If a function doesn’t need private network access, it may be worth removing the VPC attachment altogether. That can trim cold-start duration as well as network overhead [2].
For orchestration, steer clear of the “Lambda calling Lambda” anti-pattern. A synchronous Lambda-to-Lambda call means you’re paying for one function to sit and wait on another. Step Functions Express Workflows handle that job more efficiently at $0.000025 per transition [5][2]. In the same vein, HTTP API Gateway cuts request cost by 71% [5].
4. Checklist: control platform, logging and ancillary service costs
Once you've cut invocations and tightened function settings, the function itself usually stops being the main source of waste. The bigger drain often comes from the services around it. API gateways, CloudWatch logs and data transfer can make up as much as 78% of a total serverless bill [5]. So it helps to treat these supporting services as core cost drivers, not afterthoughts. Start with platform charges, then work through log, storage and data-transfer waste.
4.1 Review pricing tiers, regions and non-production settings
Look at gateway features first, then pick the lowest-cost tier that still does the job. Do the same with regions: choose the lowest-cost region that still meets latency and data residency needs.
For non-production environments, set reserved concurrency to 0 on any function that doesn't need to stay live. Think of it as a hard kill switch. It stops a forgotten dev environment from quietly building up charges overnight [5].
Once gateway and region choices are locked in, move to logs and shared services.
4.2 Reduce API, queue, storage and log costs
CloudWatch logs often make up 15–25% of a serverless bill, and indefinite retention keeps storage charges ticking over at $0.03 per GB per month [5]. Set clear retention rules instead. A sensible starting point is:
Keep production logging at INFO. In high-volume functions, sample successful invocations and keep all errors. Debug logging in production can push costs up fast.
With recurring service costs under control, the next step is to pin them down with tags and budget alerts.
4.3 Add budgets, tagging and cost guardrails
Tag every function with service, environment, owner and cost centre [1]. If tagging is inconsistent, cost allocation and reporting get messy very fast.
Set budget alerts in £ for monthly limits and spend spikes. Anomaly detection is handy for spotting retry loops or log surges before the month-end bill lands [10][3]. It also helps to set architectural cost budgets, such as a maximum of £0.05 per checkout transaction, and track them in your regular delivery rituals [1][10].
5. Checklist: keep optimisation running over time
Once the main controls are in place, don’t leave them alone for months. Serverless costs can move fast. A code change, a traffic spike or a dependency update can shift a function’s cost profile overnight. Treat optimisation as a continuous operating model, not a one-off project [4][1].
5.1 Set a regular monitoring and review cadence
After right-sizing and event-flow changes, check whether the savings are still there.
Track the same unit economics over time. Using the same metrics in each review cycle makes drift much easier to spot.
| Check | Frequency | Metric to Watch |
|---|---|---|
| Memory rightsizing | Quarterly | p95 duration vs. memory used |
| Log retention audit | Monthly | GB ingested vs. retention policy |
| Concurrency caps | Weekly | Throttling rate vs. reserved limits |
| Tagging audit | Monthly | % of untagged resources |
| Orphaned functions | Monthly | Invocations = 0 (last 30 days) |
| Anomaly detection | Real-time | Cost per 1,000 requests |
This kind of cadence helps teams avoid a common trap: assuming a function is still cheap just because it was cheap last quarter.
5.2 Automate policy checks in delivery pipelines
Manual reviews often find problems after the damage is done. A better move is to stop waste before it hits production. When you build automated checks into your CI/CD pipeline, oversized memory settings, long timeouts, missing cost-allocation tags and verbose log levels get flagged at the pull request stage, not at month-end [2][4].
Function-level cost attribution keeps ownership with the engineering team. It also makes the financial effect of design choices visible during sprint reviews and postmortems [2][1]. Service Control Policies (SCPs) can block deployment of any function missing required tags [4]. Pair that with AWS Config rules to surface non-compliant functions and send alerts to your team automatically. Set anomaly alerts to trigger when a function’s cost rises by more than 20% week on week without a matching rise in transaction volume [4].
Automated checks help keep cost controls in place as the system changes.
5.3 Conclusion: a core checklist for lower-cost serverless at scale
Measure, right-size and govern continuously. The best results come when cost stays visible in sprint reviews and postmortems, not in finance-only reports, so the link between technical tuning and stateless serverless cost governance becomes part of how the team ships, not a separate workstream [2][1].
FAQs
Where should I start with serverless cost optimisation?
Start with a workload analysis and monitor current usage to spot inefficiencies, underused resources and cost hotspots.
Then focus on right-sizing resources, especially function memory, set sensible auto-scaling limits, and review your architecture for avoidable costs such as excessive invocations, data transfer or logging.
How do I know if my function memory is too high?
Monitor your function’s actual memory use while it runs. If it consistently uses only 15–25% of the memory you’ve allocated, you’re probably giving it more than it needs.
That can push costs up for no good reason, so it’s worth lowering the memory setting.
Which hidden serverless costs are easiest to miss?
The easiest hidden serverless costs to miss are data transfer expenses, retries, and payload size-related charges. They don’t always stand out at first glance, but they can quietly push your bill up if you’re not watching them closely.