
Service mesh cost is often simple: more pods and more traffic mean more CPU, more memory, and more spend. In the article, I show that idle sidecars can add 50–100m CPU and 50–100 MiB RAM per pod, which can turn into thousands of pounds a year in AWS London. I also break the cost into data plane, control plane, and telemetry, then show how I would measure each one against a mesh-free baseline.
If I wanted the short version, it would be this:
- Start with a baseline: run the same workload without the mesh
- Measure deltas: CPU, RAM, p99 latency, throughput, and storage
- Price the delta: convert extra cores and GiB into £/month
- Cut the biggest costs first:
- limit mesh use to the services that need it
- trim tracing, logs, and noisy metrics
- reduce proxy scope and right-size requests/limits
- compare sidecars with lighter options such as Ambient mode
A few numbers stand out:
- 100 pods can mean about 7.5–10 extra CPU cores
- 500 pods can mean about £13,000+ per year in idle sidecar cost alone
- telemetry can take 5–20% of sidecar CPU
- moving from sidecars to Ambient L4-only can cut proxy cost by about 93% in the example given
I’m not repeating every detail from the piece. Instead, I’d sum it up like this: measure first, price the overhead in plain £ terms, then trim scope, proxy load, and telemetry before the bill grows with cluster size.
Cut Service Mesh Overhead by 90%+ with Istio Ambient Mesh | Solo.io

Need help optimizing your cloud costs?
Get expert advice on how to reduce your cloud expenses without sacrificing performance.
The problem: where resource overhead shows up
Overhead builds up in three places: the data plane, the control plane and observability.
Data plane costs: sidecars, ambient mode and node-level processing
The data plane is usually where teams feel the cost first. An idle Istio sidecar uses about 40–60 MB of RAM and 10–50m CPU per pod [4]. Push traffic to around 1,000 HTTP requests per second, and that rises to roughly 0.20 vCPU and 60 MB per sidecar [7]. In a 50-pod cluster, that means 2.5 GB of RAM is gone before a single line of app code does any work [8].
Where that cost appears depends on the architecture. Linkerd’s Rust-based micro-proxy sits at around 10 MB idle per pod [8]. Istio’s Ambient mode swaps per-pod sidecars for a shared per-node ztunnel proxy for Layer 4 traffic. If you need app-layer features, you still need Waypoint proxies, which add about 0.25 vCPU each [7]. Cilium takes a different route and moves the work into the Linux kernel with eBPF, so there are no user-space proxies at pod level.
That sounds neat on paper, but there’s a trade-off. Node-level and eBPF setups trim per-pod overhead, yet they can make debugging and tooling harder. So if you want to know what the mesh is costing you, start here. The data plane tends to drive the per-pod bill.
Control plane and policy costs at cluster scale
The control plane has its own price tag. In Istio, Istiod distributes config, rotates certificates and pushes policy updates to every proxy in the mesh. At 4,000+ services, frequent config pushes triggered Envoy reload storms. Endpoint caching and debounce tuning cut those reloads by 70% [5].
By default, each proxy gets full-mesh config. In a big cluster, that means every sidecar carries routing rules, endpoints and certificates it doesn’t even use. Using Istio Sidecar resources to limit what each proxy receives cuts memory use and reduces the time needed to push updates [3][4].
At cluster scale, control-plane overhead tends to show up as:
- extra memory use
- slower config pushes
- more node pressure
Observability costs: metrics, traces and access logs
Observability spend is easy to miss because it often lands outside the compute bill. But it still hits the monthly budget. Envoy can burn 15–20% of its CPU budget on stats collection alone when Prometheus label cardinality is high [5]. Run distributed tracing at 100% sampling on a busy cluster, and the data volume gets huge. Add verbose access logs on top, and the cost climbs again [4].
For UK FinOps teams, that means more than noisy dashboards. It means direct ingestion and storage charges, often shown as a separate line item rather than part of core compute.
The first fixes are usually straightforward:
- cut trace sampling to 1% for routine traffic
- remove high-cardinality labels you don’t query, such as
request_protocolorresponse_flags - keep verbose logs only on the services that need them [3][4]
Next, compare each layer with a mesh-free baseline so you can isolate the cost you’re actually paying.
How to measure service mesh overhead
Once you know where the overhead comes from, the next step is simple: measure it against a mesh-free baseline. If the test isn't repeatable, the numbers won't mean much. You need a setup that isolates the mesh cost as cleanly as possible.
Build a clean baseline without the mesh
Run the workload on Kubernetes without the mesh first. Keep the request rate, payload, protocol, and client connections fixed for several hours. Then capture CPU, memory, throughput, and p99 latency.
One thing matters here: only use the steady-state window. Filter out warm-up and cool-down periods, because they can distort the average and give you a false read on normal performance [2][4][10].
From the start, measure the application and sidecar containers separately. That gives you a control result you can use for every later comparison.
Compare mesh modes and feature sets under the same load
Next, rerun the exact same test with the mesh turned on. After that, change one setting at a time. That might be mTLS, tracing, log levels, or filter chains.
Everything else needs to stay fixed:
- node SKUs
- Kubernetes version
- CNI plugin
- payload size
- request rate
- protocol
If any of those shift, the comparison gets skewed and the result stops being trustworthy [4][10].
If you're comparing sidecar and ambient modes, make sure the Layer 7 behaviour is matched as closely as possible. For example, if one mode uses waypoints, the other test should reflect similar Layer 7 functionality too. Otherwise, it isn't a like-for-like comparison [2].
These deltas are what tell you which mesh features are costing you CPU, memory, and latency.
Convert technical overhead into monthly cost
Once you have the delta - the extra vCPU and GiB of memory added by the mesh - turning that into a monthly £ figure is fairly direct. Use this formula:
(Total extra cores × cost per core/hour × 730 hours) + (Total extra RAM in GiB × cost per GiB/hour × 730 hours) [11]
At 100 pods, idle sidecars add about 7.5 cores and 7.5 GiB of RAM, which works out to roughly £2,770 per year [1][11]. Push that to 500 pods and the numbers climb to 37.5 cores and 37.5 GiB of RAM - about 10 dedicated nodes and roughly £13,840 annually [1][11].
A good way to report this is as £ per 1,000 requests per second. That's much easier to grasp than a raw infrastructure number, and it shows how cost grows with user activity [11].
Also include Prometheus and logging storage in the same monthly total. Stats collection by itself can use 15–20% of Envoy's CPU consumption in high-cardinality setups, and that cost often shows up as a separate bill line [5].
Use the highest-cost deltas to decide what to tune next.
The solution: practical ways to cut mesh cost
::: @figure 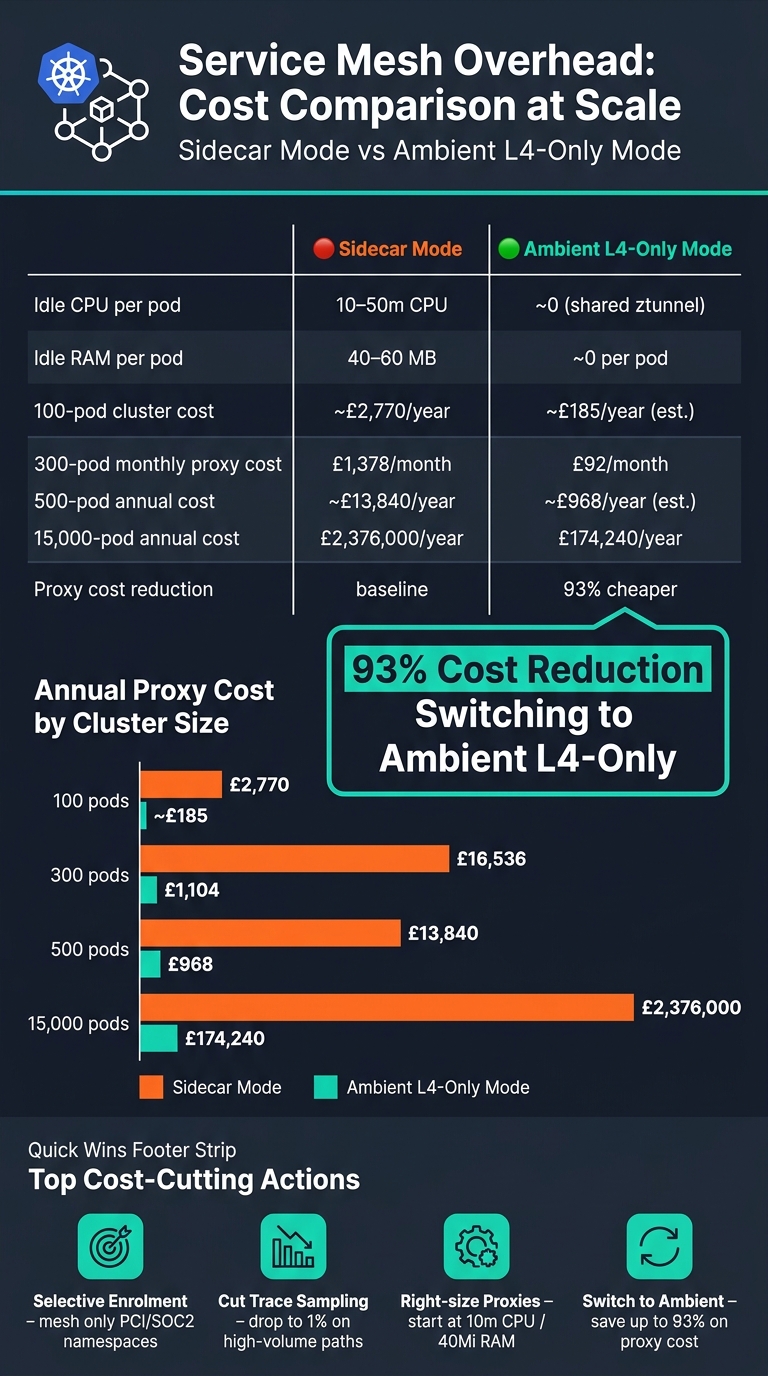 {Service Mesh Cost: Sidecar vs Ambient Mode at Scale}
:::
{Service Mesh Cost: Sidecar vs Ambient Mode at Scale}
:::
Once you know where the overhead sits, you can make targeted cuts. The aim isn't to gut the mesh. It's to stop paying for coverage and features you don't need.
Narrow scope and choose the lightest workable architecture
Start with the baseline deltas and decide which workloads need mesh coverage at all. The biggest saving usually comes from selective mesh enrolment. Put the mesh only around namespaces or services that need mTLS, compliance controls such as PCI-DSS or SOC2, or advanced traffic management. Leave development, staging, and batch namespaces outside the mesh with istio-injection: disabled.
If your main need is L4 security, a lighter setup may make more sense. In a 300-pod cluster, moving from sidecar mode to Ambient L4-only mode can cut monthly proxy cost from £1,378 to £92. That's a 93% saving [6]. At 15,000 pods, a sidecar-based mesh is estimated at £2,376,000 per year, while a similar Ambient deployment with waypoints lands at about £174,240 [9].
If you still need L7 policy, use Sidecar to limit each proxy's upstream scope.
Tune proxies, policies and telemetry based on measured usage
After you've reduced scope, tune what's left to match measured demand. Set proxy requests and limits from actual usage, not padded defaults. For low-traffic services, 10m CPU and 40Mi memory is a sensible starting point [4][3].
Protocol choice matters too. Shopify found that after moving to Istio, p99 inter-service latency went up by 3–4 ms because mTLS handshakes added cost on short-lived HTTP/1.1 connections. By requiring HTTP/2 for internal traffic and turning on Envoy connection coalescing, it cut handshake frequency by 80% [5].
Telemetry is another easy place to trim spend:
- Drop tracing sample rates to 1% on high-volume paths
- Remove metric labels you don't use
- Turn off verbose access logs where they add little value
Envoy often runs 10–15 filters by default, so removing unused ones cuts per-request processing time [5].
For trusted internal traffic, such as database connections, use traffic.sidecar.istio.io/excludeOutboundPorts to bypass the proxy on ports like 5432 or 6379.
Use consulting and automation to keep costs in check
Savings don't stick on their own. Mesh cost control needs regular checks. Automate benchmarks with tools such as Fortio, enforce namespace labels with admission controllers, and build cost dashboards that show proxy spend next to application metrics. That way, you can spot drift before it turns into a bigger bill.
For benchmarking automation, selective injection, or a low-risk move to lighter mesh architectures, Hokstad Consulting can help.
Conclusion: measure first, then optimise continuously
Service mesh overhead falls into three cost buckets: data plane, control plane and observability. The key is to measure each one instead of guessing. Start with the baseline you’ve already got. That’s how technical overhead turns into a budget call, not just an engineering debate.
From there, the biggest wins usually come from scope, sizing and telemetry. [1]
Once you know the baseline, the job shifts to day-to-day discipline. As OneUptime's Nawaz Dhandala notes, savings add up as clusters get larger. [12] It makes sense to review things again when you pass 100 pods, hit a traffic jump, or face a new compliance requirement. [1] Old VirtualServices, DestinationRules and ServiceEntries can quietly pile extra load onto the control plane if no one clears them out.
This isn’t about a one-time cut in spend. It’s about building a repeatable control loop. Use Prometheus and Grafana to watch 95th-percentile sidecar CPU and memory over time. The aim is drift detection, not a single point-in-time check. [12] If you need a hand setting up that process, Hokstad Consulting works with engineering and FinOps teams to keep mesh spend under control.
FAQs
How do I measure mesh overhead fairly?
Start with a clean baseline: deploy the same application twice - once with the mesh sidecar injected and once without it. Then run the same request patterns against both setups using Fortio or a similar load-testing tool.
Track CPU and memory in Prometheus, with close attention to the istio-proxy container. The main things to watch are:
- p99 latency per hop
- Resource use per pod
- CPU throttling rates
That gives you a clearer view of what the mesh itself is adding, instead of mixing its effect with changes in app behaviour.
When is a service mesh worth the cost?
A service mesh is usually worth the cost once your organisation reaches roughly 20 to 100 microservices. At that point, keeping service-to-service communication secure and consistent starts to get messy fast.
It also makes sense when you need strict compliance, such as PCI, HIPAA or SOC 2, and must use mTLS for internal service connections. On top of that, a mesh helps teams that want the same observability across services, centralised traffic rules, or frequent canary releases.
For smaller setups with around 5 to 15 services, the maths often doesn’t work. If your team also doesn’t have the time or headcount to handle the extra complexity and resource overhead, a mesh is usually hard to justify.
Which mesh settings waste the most resources?
The biggest drain usually comes from sidecar proxy setups. In that model, each application pod runs an extra container, which means more CPU and memory use straight away.
mTLS can add the heaviest performance hit. In some setups, it can cut throughput by as much as 95%.
Other common sources of overhead include default settings that send the full cluster configuration to every sidecar, along with high tracing levels, verbose access logging, and telemetry collection that teams don’t need.