
A service mesh can add £780 to £2,350 per month in extra compute on a 200-pod cluster, and most of that spend comes from sidecars, telemetry, and mesh scope. If I want to cut costs without hurting latency, uptime, or compliance, I’d start with four moves: measure sidecar requests in £, shrink mesh coverage, trim noisy telemetry, and pick the right data plane model.
Here’s the short version:
- Sidecars are often the main cost: each Envoy proxy can use 50–100m CPU and 50–100 MiB RAM even when idle.
- Requests matter more than usage: in Kubernetes, I pay for reserved capacity, not just what gets used.
- Telemetry can become a quiet storage bill: logs, metrics, and traces can cost more than teams expect.
- Scope matters: fewer namespaces, fewer proxies, and fewer gateways usually means a lower monthly bill.
- Ambient or eBPF-based models can cut overhead: sidecar-free approaches can reduce idle proxy cost by a large margin.
- Not every workload needs the mesh: dev, batch, and some internal traffic paths may not need full mTLS and L7 features.
- Guardrails stop costs creeping back: default sidecar sizing, low trace sampling, and team showback in £ help keep spend under control.
If I were reviewing a mesh today, I’d check three things first:
- How much am I spending on sidecar CPU and memory each month?
- Which namespaces and features are in the mesh without a clear reason?
- Can I keep security needs met with a lower-overhead setup?
A quick comparison of the main cost levers:
| Area | What drives cost | What I’d look at first |
|---|---|---|
| Sidecars | Per-pod CPU and RAM | Requests vs P95 usage |
| Control plane | Service count, config churn | Namespace filtering, debounce tuning |
| Gateways | Extra Envoy instances and load balancers | Shared ingress where possible |
| Telemetry | Logs, metrics, traces | Error-only logs, 1% trace sampling |
| Data plane choice | Sidecar per pod vs node-level proxying | Ambient mode or eBPF where fit allows |
| Mesh scope | Too many enrolled workloads | Remove low-risk namespaces and bypass low-value paths |
The article boils down to one idea: I should treat service mesh cost as a design problem first, and a tuning problem second. Measure the bill in plain £, remove work the mesh does not need to do, then lock the savings in with policy.
Cut Service Mesh Overhead by 90%+ with Istio Ambient Mesh | Solo.io
Need help optimizing your cloud costs?
Get expert advice on how to reduce your cloud expenses without sacrificing performance.
Measure the Real Cost of Your Mesh
Measure first; optimise second. Once you know the main cost drivers, the next job is to find where they appear in your cluster and your bill.
Build a Baseline from Cluster Metrics and Billing Data
Start with kubectl top pods across all namespaces. It gives you a rough view of where CPU and memory are going. For anything more exact, move to Prometheus. Use requests to model spend, and usage to spot waste. Kubernetes billing is tied to requested capacity, not only what you happen to use, so requests are the number that matters.
A handy PromQL query for wasted sidecar CPU is [8]:
sum(clamp_min(sum by (pod) (kube_pod_container_resource_requests{container="istio-proxy", resource="cpu"}) - sum by (pod) (rate(container_cpu_usage_seconds_total{container="istio-proxy"}[5m])), 0))
Turn CPU and memory requests into £ so you can track monthly mesh spend in plain terms. Based on AWS m5.xlarge on-demand pricing, a vCPU core costs about £27.50 per month and 1 GB of RAM costs about £6.90 per month [1][9]. Apply those rates to your total mesh-attributed requests and you’ll get a working monthly figure to track.
Once you have that rough monthly total, split it into sidecar, control plane and telemetry spend.
Break Down Sidecar, Control Plane and Telemetry Spend
Split spend into sidecars, control plane, gateways and telemetry so you can see what to trim first. The point is simple: go after the biggest line item you can control.
| Component | Estimated Monthly Cost |
|---|---|
| Sidecar compute | £223 |
| Control plane (3 replicas) | £124 |
| Gateways + load balancer | £59 |
| Observability storage (logs, metrics, traces) | £50 |
| Engineering time | £1,475 |
| Total | £1,931 |
Engineering time is often the biggest single cost, and it’s also the one teams most often leave out [9]. Log volume can turn into a serious storage bill too, so it belongs in your baseline.
If you want to isolate costs by team or service, use sum by (namespace) or sum by (pod) in PromQL. Filtering on the istio-proxy container name separates sidecar spend from app logic. Scoping to the istio-system namespace isolates control plane usage.
After you’ve split the spend by component, measure the performance cost before you touch the config.
Measure Latency and Throughput Overhead Before Making Changes
Cost cuts only make sense if latency and throughput stay inside target. Benchmark before and after every change. Tools like Fortio, wrk, and k6 are a good fit. Run the same service with injection on and off, then measure p50, p95 and p99 latency alongside throughput in requests per second [4].
A 2025 peer-reviewed study found that Istio sidecars with mTLS enforced showed a 166% increase in latency compared with baseline workloads [6]. Over multiple hops, that overhead can stack up fast. Record those numbers as your baseline so cost cuts don’t chip away at SLOs.
Design Choices That Have the Biggest Cost Impact
::: @figure 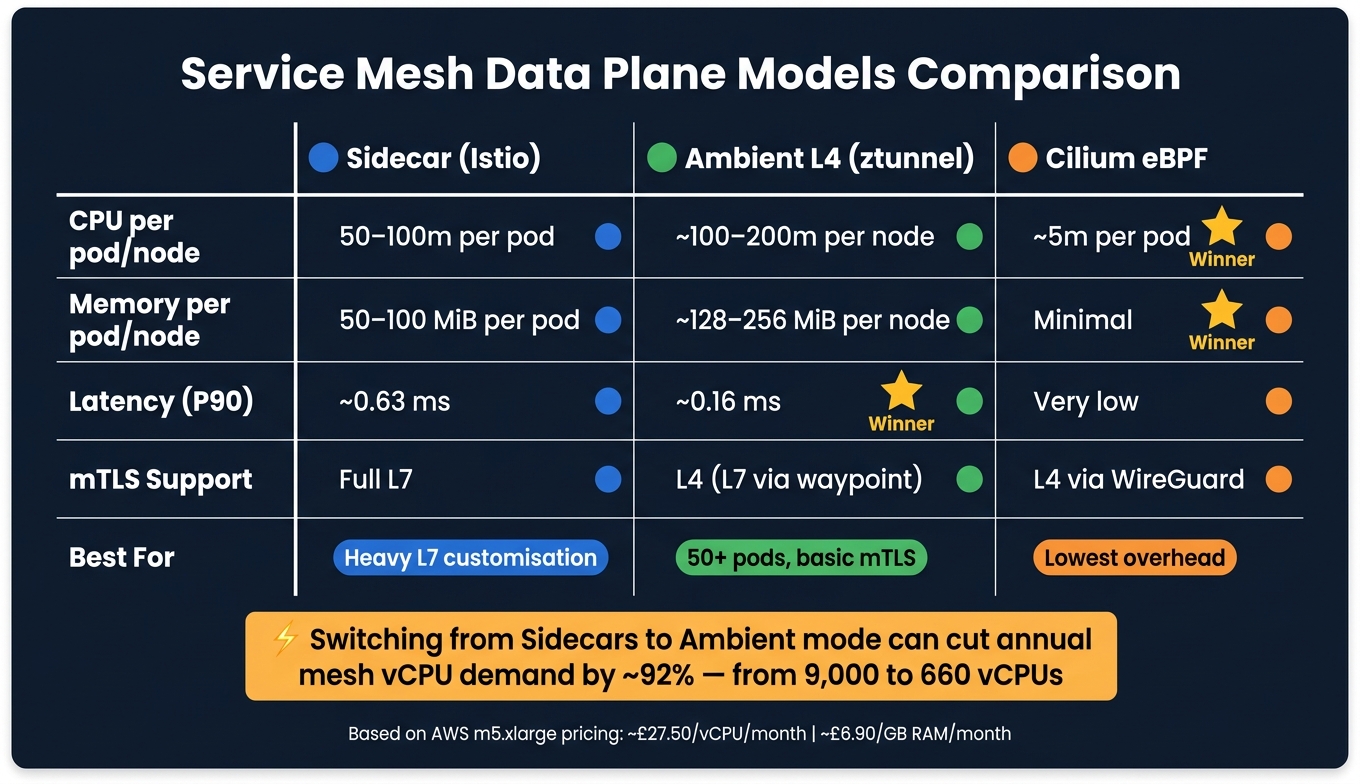 {Service Mesh Data Plane Cost Comparison: Sidecar vs Ambient vs eBPF}
:::
{Service Mesh Data Plane Cost Comparison: Sidecar vs Ambient vs eBPF}
:::
Once you have a cost baseline, the biggest savings usually come from scope, data-plane choice, and feature sprawl. In plain terms, the moves that change your monthly bill are architectural ones: how far you roll out the mesh, which data plane model you pick, and which features you turn on.
Scope and Topology: Cluster-wide, Namespace-specific and Multi-cluster Meshes
A smaller scope usually means a smaller bill. Fewer watched namespaces means fewer config pushes and less load on the control plane. Using discovery selectors to limit the control plane to labelled namespaces cuts CPU and memory use, and it also reduces config pushes [1].
The same idea applies to gateways. Every ingress gateway is its own Envoy instance sitting behind a cloud load balancer. On AWS, a Network Load Balancer costs around £13–£16 per month before data processing charges [1][9]. That sounds modest on its own, but the spend stacks up fast when teams deploy several gateways that do much the same job. In many cases, one shared ingress gateway serving multiple TLS hosts through SNI is the cheaper setup [1].
Multi-cluster layouts add another layer of spend, and cross-cluster traffic passes through extra encrypted hops. In multi-AZ setups, those hops can also trigger cross-AZ data transfer charges of about £0.008 per GB [9]. There is also a performance cost. In a sidecar mesh, each inter-service call already goes through two proxies, so adding cluster boundaries adds more overhead on top.
If trimming scope still does not cut enough cost, the next step is to change the proxy model.
Sidecar-based versus sidecar-free approaches
If scope changes are not enough, the next big lever is the data plane itself. This is the biggest cost lever [2][5]. Sidecar-based meshes add an Envoy proxy to every pod, which creates a fixed per-pod cost whether that pod handles heavy traffic or sits mostly idle. At 100 pods, that works out to 10 extra CPU cores running all day, every day. At 500 pods, you are looking at a dedicated node tier just to run proxies [2][3].
Istio's Ambient mode swaps per-pod proxies for a shared ztunnel DaemonSet for L4 traffic, plus optional waypoint proxies for services that need L7 features such as header-based routing. That changes the resource pattern from per-pod to per-node, which cuts idle overhead as you scale. In one projected analysis of a large deployment, moving from sidecars to Ambient cut annual mesh vCPU demand from 9,000 to 660, a saving of about 92% [10].
| Feature | Sidecar (Istio) | Ambient L4 (ztunnel) | Cilium eBPF |
|---|---|---|---|
| CPU per pod/node | 50–100m per pod [3] | ~100–200m per node [2] | ~5m per pod [3] |
| Memory per pod/node | 50–100 MiB per pod [3] | ~128–256 MiB per node [2] | Minimal [3] |
| Latency (P90) | ~0.63 ms [10] | ~0.16 ms [10] | Very low [3] |
| mTLS support | Full L7 [3] | L4 (L7 via waypoint) [2] | L4 via WireGuard [3] |
Ambient mode makes sense when your cluster has more than 50 pods and mainly needs basic mTLS. If you depend on heavy L7 customisation, such as WASM filters or other features that are not yet stable in Ambient, sidecars are still the safer fit [5][3].
Security and Observability Features That Increase Spend
After topology and data-plane choice, feature flags are where costs quietly creep in. It helps to treat each feature as something you enable on purpose, not by default.
mTLS adds handshake overhead on each connection and adds latency at each hop [4]. For production and compliance workloads, including PCI-DSS or SOC 2, that cost is often worth paying. In development and staging namespaces, it may add little day-to-day value, so turning it off can save resources.
Telemetry is often the hidden bill-payer. For a platform handling 10 million requests a day, access logs alone can produce 225 GB of data per month. That can cost about £5.40 on S3 or £90 on Elasticsearch [9]. Distributed tracing adds header overhead and a lot more span storage. Dropping trace sampling to 1% or less can cut storage spend sharply without losing the main signal you need [1][9].
Here is the quick view:
| Feature | Resource Impact | Recommendation |
|---|---|---|
| mTLS | Medium (CPU, latency) | Enable for production and compliance workloads [3] |
| L7 metrics | High (storage, CPU) | Disable for dev and staging [3] |
| Distributed tracing | High (network, storage) | Use 1% sampling or lower [1] |
| Egress gateway | Medium (compute, load balancer) | Skip unless outbound compliance requires it [1] |
| Per-request authorisation | Medium (latency) | Scope to services that genuinely need it [4] |
Practical Ways to Cut Service Mesh Resource Usage
Start with the biggest drains on spend: proxies that are too large, config that reaches too far, and traffic that never needed to pass through the mesh in the first place.
Right-size Sidecars and Control Plane Components
Use the P95 figures from the previous section to reset sidecar requests so they line up with what the proxy actually uses [12]. If P95 usage sits below 30% of requests, that sidecar is over-allocated [12]. For bursty services, set limits at 2–3× P95 so they still have room when traffic jumps [12]. And for lightly loaded services, set Envoy concurrency to 1 to cut idle CPU burn [11][12].
For latency-sensitive workloads, set CPU limits equal to requests to reduce p99 spikes [7]. There is a trade-off here: Guaranteed QoS can mean more over-provisioning [7].
On the control plane side, tune PILOT_DEBOUNCE_AFTER to about 500ms and PILOT_DEBOUNCE_MAX to about 5s. That batches config updates and helps stop reload storms [1][7]. Uber reported that tuning these debounce settings reduced Envoy configuration reload events by 70% across its 4,000-plus service estate [7].
Once requests are set properly, the next step is simple: cut down what each proxy has to know about.
Turn Off Low-value Features and Narrow Mesh Coverage
Scope each proxy to only the services it needs. Using the Sidecar CRD to limit egress to real dependencies can reduce proxy memory usage by 80% in a 100-service mesh and by up to 94% in a 1,000-service mesh [11]. That has a direct effect on compute and memory spend.
It also helps to shrink the mesh itself. Development, staging, and batch-processing namespaces often don't need mTLS or L7 observability, so turning off sidecar injection there removes the overhead altogether [3][1]. The same logic applies to high-volume, trusted connections. For database traffic on ports 5432 or 3306, the traffic.sidecar.istio.io/excludeOutboundPorts annotation lets traffic bypass the proxy and skip an extra hop [4]. That cuts both compute usage and load-balancer spend.
Telemetry is another area where costs creep up fast. Dropping expensive histograms, removing high-cardinality labels, and logging only errors or slow requests cuts Envoy CPU, storage I/O, and downstream storage costs in one move [11].
| Optimisation Action | Primary Cost Category | Impact Level |
|---|---|---|
Sidecar scoping (Sidecar CRD) |
Memory | High |
| Discovery selectors (namespace filtering) | Control plane CPU and memory | Medium |
| Disabling access logs (error-only logging) | CPU, storage I/O | Medium |
| Reducing trace sampling to 1% | CPU, network bandwidth, storage I/O | Medium |
| Tuning Envoy concurrency (2 → 1) | CPU (idle), memory | Low–Medium |
| Delta xDS (incremental updates) | Network bandwidth, CPU | Medium |
| Consolidating ingress gateways | CPU, memory, load balancer costs | Medium |
After trimming scope and telemetry, the next layer is handshake and scheduling overhead.
Tune mTLS, Autoscaling and Placement Policies
Use HTTP/2 or gRPC for internal traffic so connections can be reused and multiplexed. That reduces mTLS handshake frequency by over 90% [7]. You keep the security upside of mTLS, but cut much of the per-connection latency cost.
For autoscaling, set HPA targets at 70–80% CPU for gateways and istiod instead of sizing them around static peak levels [1][11]. It also pays to right-size sidecars first. If requests are inflated, the cluster can add new nodes before application demand actually calls for them [1].
Node shape matters too. Using larger nodes, such as 8 vCPU instead of 4 vCPU, spreads fixed mesh overhead across more workloads and cuts wasted headroom [1]. In mixed environments, node affinity can keep control plane components on on-demand instances while application pods run on spot or pre-emptible instances [1].
Governance, FinOps and Next Steps
Cost cuts only last when ownership is clear and the rules are hard to dodge.
Set Platform Guardrails and Cost Ownership
Once the technical work is finished, back it up with policy. Platform engineering should own mesh policy and defaults. That means setting sane values in MeshConfig, such as 50m CPU and 64MiB memory for sidecar requests and limits, so individual teams can't quietly over-provision across the estate [3][4]. Namespace enrolment should also be policy-driven, with only workloads that have a clear operational need allowed into the mesh.
Telemetry needs the same treatment. Keep tracing sampling at 1% or less across the board, and make access logging lean by default. Turn on noisy logging only when there's a clear reason to do it [1][4].
For cost visibility, publish showback in £ per service or £ per team. Using AWS m5.xlarge rates, sidecar CPU and memory work out at about £27 per vCPU per month and roughly £7 per GB RAM per month [1][9]. That gives you a simple way to map mesh spend to the services or business units driving it.
It also helps to set Prometheus alerts for backsliding. For example:
- Trigger an alert when sidecar memory goes above 150 MB
- Trigger an alert when proxy P99 latency passes 50 ms [4]
That way, teams catch problems early instead of finding them after costs have already crept up.
Use Staged Experiments to Avoid Costly Regressions
After the guardrails are in place, roll out changes in small batches. Any big shift, whether that's switching proxy modes, changing telemetry policy, or moving namespaces to Ambient mode, should begin with one non-critical namespace. Expand only after the numbers stay where they should be [2][5].
Mixed-mode coexistence makes this much easier. Sidecar-injected workloads and Ambient workloads can run side by side, so teams can migrate one namespace at a time instead of betting the whole cluster in one go [10]. During that move, use PERMISSIVE PeerAuthentication so connections don't drop before workload identities are fully verified [10].
Each change should go through a formal before-and-after review against cost, CPU, memory, latency and SLO targets before anything rolls further. It's a simple habit, but it stops well-meant changes from creating regressions that cost more to fix than the saving was worth.
Conclusion: The Cost Savings That Matter Most
These controls stop savings from leaking back into the mesh. The biggest gains usually come from getting a proper baseline, stripping out work the mesh doesn't need to do, and putting rules in place so it stays that way. A 200-pod cluster can carry £780–£2,350 per month in extra compute costs [1], and a large share of that can be recovered through scoping, right-sizing and policy.
If your organisation needs help analysing Kubernetes and service mesh costs, redesigning for lower overhead, or automating cost controls into your DevOps pipelines, Hokstad Consulting specialises in exactly that work.
FAQs
How do I calculate my mesh cost in £?
First, add up the resource reservations across the whole mesh. That means application pods, sidecars, the control plane, and any ingress or egress gateways.
For Kubernetes, you can do that with PromQL against kube-state-metrics.
CPU requests
sum(
  kube_pod_container_resource_requests{
    resource="cpu",
    unit="core"
  }
)
If you want to look only at mesh-related components, filter by namespace, pod, or container labels. For example:
sum(
  kube_pod_container_resource_requests{
    resource="cpu",
    unit="core",
    namespace=~"istio-system|linkerd|mesh-system"
  }
)
Memory requests
sum(
  kube_pod_container_resource_requests{
    resource="memory",
    unit="byte"
  }
)
And the mesh-scoped version:
sum(
  kube_pod_container_resource_requests{
    resource="memory",
    unit="byte",
    namespace=~"istio-system|linkerd|mesh-system"
  }
)
If your sidecars sit inside app namespaces, you’ll usually need to filter by container name as well, such as container="istio-proxy".
A more practical split looks like this:
- Sidecars
- Control plane
- Gateways
Example for sidecars:
sum(
  kube_pod_container_resource_requests{
    resource="cpu",
    unit="core",
    container="istio-proxy"
  }
)
sum(
  kube_pod_container_resource_requests{
    resource="memory",
    unit="byte",
    container="istio-proxy"
  }
) / 1024 / 1024 / 1024
That second query converts bytes to GiB, which makes the cost maths much easier.
Convert reservations into monthly cloud cost
Once you have the totals, multiply them by your cloud provider’s monthly rate for:
- vCPU / core
- GB or GiB of RAM
Use this formula:
Monthly compute cost = (Total CPU cores × monthly £ per core) + (Total memory GB × monthly £ per GB RAM)
For example, let’s say your totals come out as:
| Component | CPU (cores) | Memory (GiB) |
|---|---|---|
| Sidecars | 12 | 24 |
| Control plane | 2 | 8 |
| Gateways | 4 | 16 |
| Total | 18 | 48 |
Now assume your cloud rate works out to:
- £24.00 per core per month
- £3.20 per GiB RAM per month
Then the monthly compute cost is:
| Cost item | Calculation | Monthly cost |
|---|---|---|
| CPU | 18 × £24.00 | £432.00 |
| Memory | 48 × £3.20 | £153.60 |
| Total compute | £432.00 + £153.60 | £585.60 |
Include observability storage costs
Mesh spend often doesn’t stop at CPU and RAM. You also need to add storage for:
- Logs
- Metrics
- Traces
The formula is simple:
Monthly storage cost = Stored GB per month × £ per GB per month
Example:
| Observability data | Stored per month | Rate | Monthly cost |
|---|---|---|---|
| Logs | 500 GB | £0.018/GB | £9.00 |
| Metrics TSDB | 120 GB | £0.023/GB | £2.76 |
| Traces | 300 GB | £0.020/GB | £6.00 |
| Total storage | 920 GB | - | £17.76 |
Total monthly mesh cost in GBP
Add compute and storage together:
| Category | Monthly cost |
|---|---|
| Compute | £585.60 |
| Observability storage | £17.76 |
| Total monthly mesh cost | £603.36 |
So the final calculation is:
£603.36/month = £585.60 compute + £17.76 observability storage
If you want this to be exact rather than estimated, swap in:
- your actual PromQL totals
- your cloud provider’s per-core and per-GB RAM prices
- your observability platform’s storage rate per GB
When should I use Ambient instead of sidecars?
Use Ambient when you want to cut infrastructure spend and trim resource overhead, especially in resource-constrained setups or new deployments that mainly need mTLS and L4 security policies. It’s also a good fit for simpler day-to-day ops, faster autoscaling start-up, and avoiding pod restarts when you roll out mesh updates.
Keep sidecars if you need deep L7 customisation, sidecar-only features, or you’re running a very small cluster where the extra overhead barely matters.
Which workloads can safely stay outside the mesh?
Workloads that can often stay outside the mesh include short-lived batch and machine learning jobs. In those cases, sidecar overhead usually doesn’t give you much back.
The same goes for development or staging namespaces that don’t have strict compliance needs.
Smaller setups with fewer than 10 to 15 services or monoliths may not be worth the extra overhead either. And if a service doesn’t need mTLS, advanced traffic shifting, or complex circuit breaking, it’s often a good candidate to leave out.