Zero downtime deployments are essential for UK businesses to ensure services remain operational during updates. By combining deployment strategies like blue-green, canary, or rolling deployments with real-time monitoring and alerts, companies can prevent disruptions and respond quickly to issues. Effective monitoring tools such as Prometheus, Grafana, and OpenTelemetry help track system health, while automated alerts ensure teams act on problems before customers are affected.
Key steps include:
- Using load balancers to maintain service availability.
- Embedding deployment metadata into logs and metrics for better tracking.
- Setting alert thresholds based on historical data to avoid false alarms.
- Automating rollbacks if performance issues arise.
Testing methods like shadow traffic, load testing, and synthetic monitoring ensure deployments don’t impact users. For cost-conscious UK firms, managing alert volumes and optimising monitoring costs are crucial. Consulting services like Hokstad Consulting offer tailored solutions, including automated pipelines and cost reduction strategies, ensuring reliable and efficient deployments.
What Zero Downtime Means
Zero Downtime Explained
Zero downtime deployment ensures that an application remains fully operational even during updates. This approach relies on a scalable and resilient infrastructure to keep services running smoothly as updates are applied to individual components.
The key to achieving this lies in the infrastructure's ability to handle updates without disrupting user access.
Key Components for Zero Downtime
One of the most important elements in maintaining uninterrupted service during updates is the use of load balancers. These tools distribute incoming traffic across multiple instances of an application. By doing so, they ensure that while one server is being updated, others continue to handle user requests seamlessly, preventing any interruptions in service.
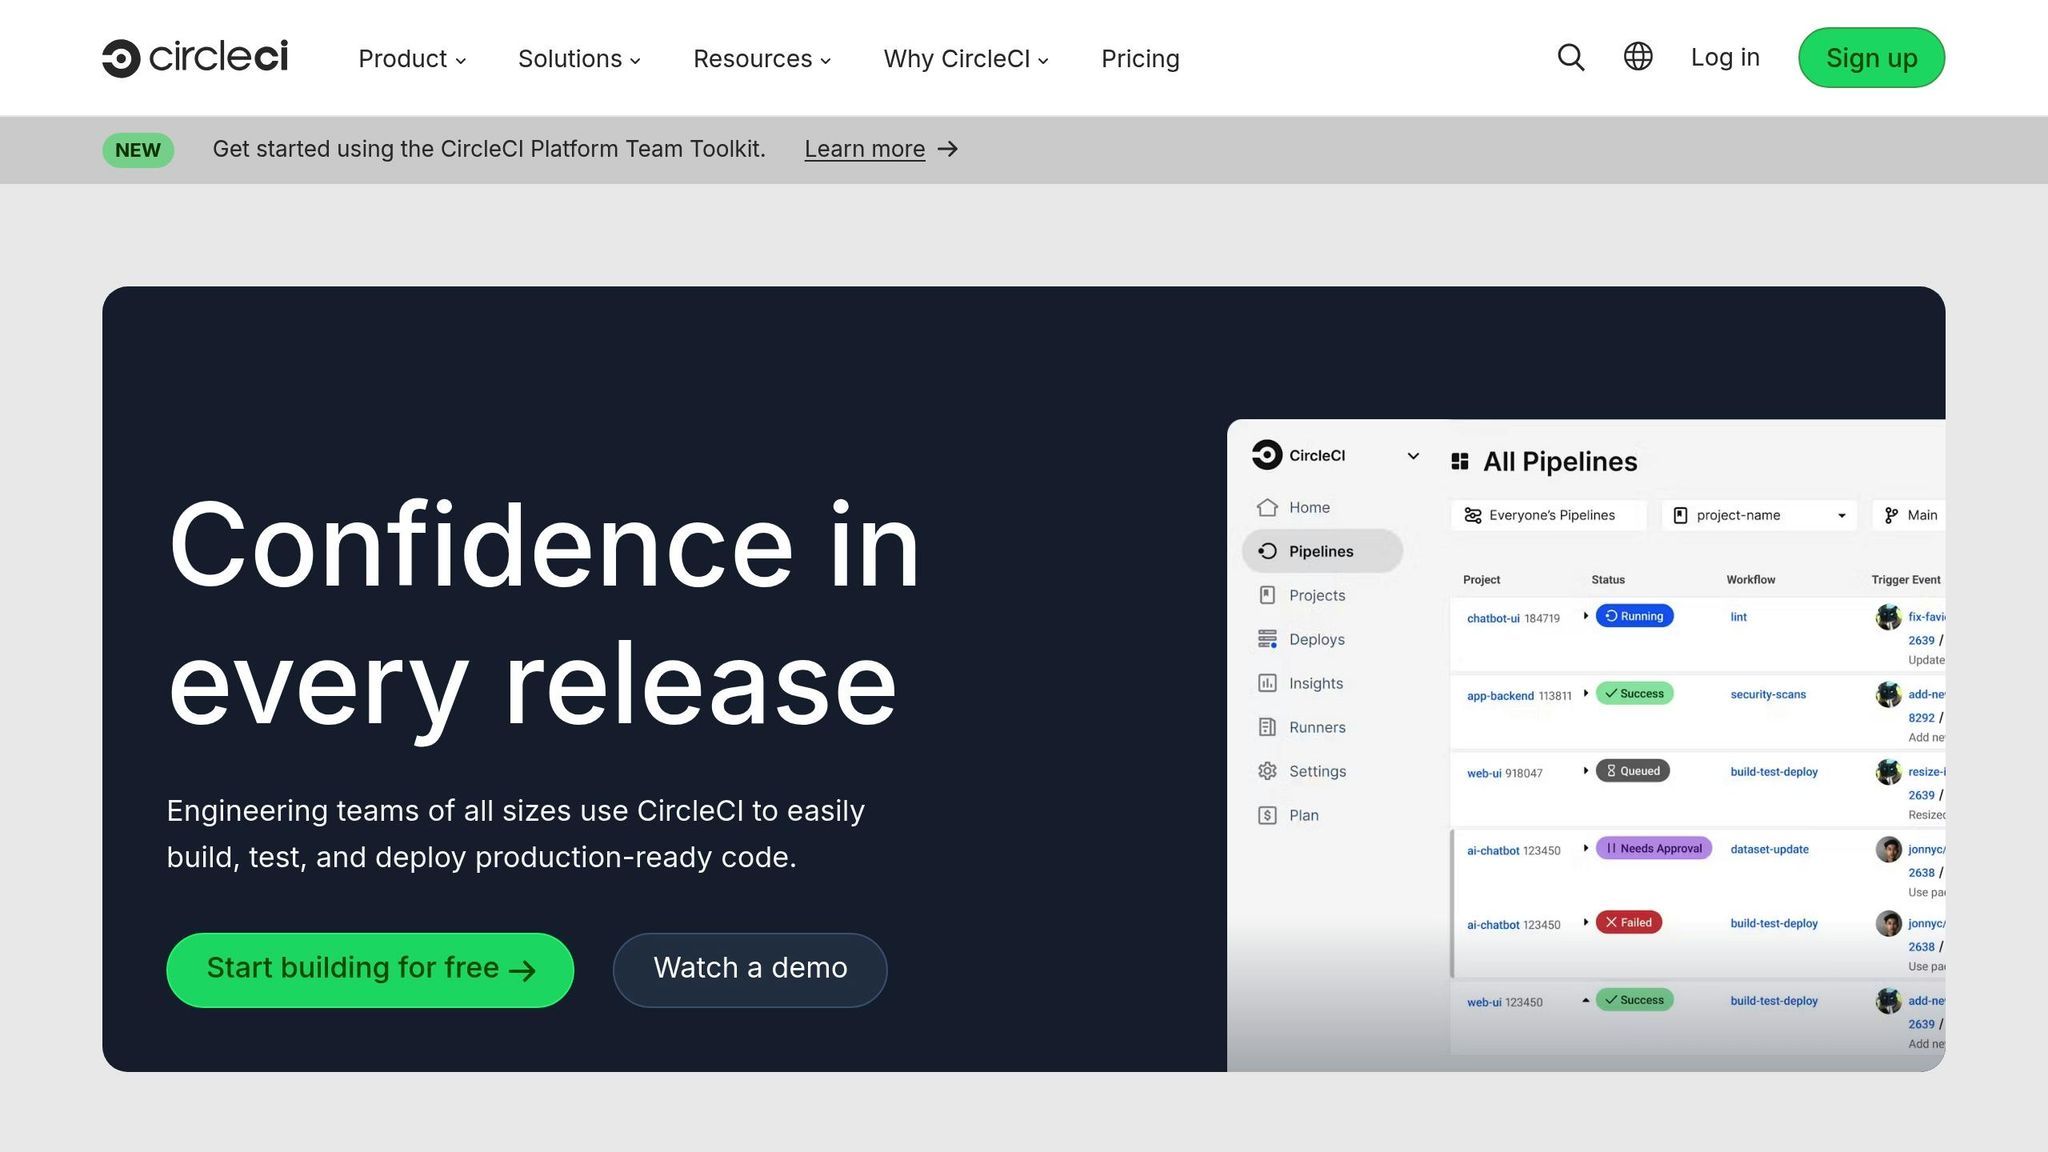
CircleCI deploys: Enterprise-scale deployment automation with zero downtime
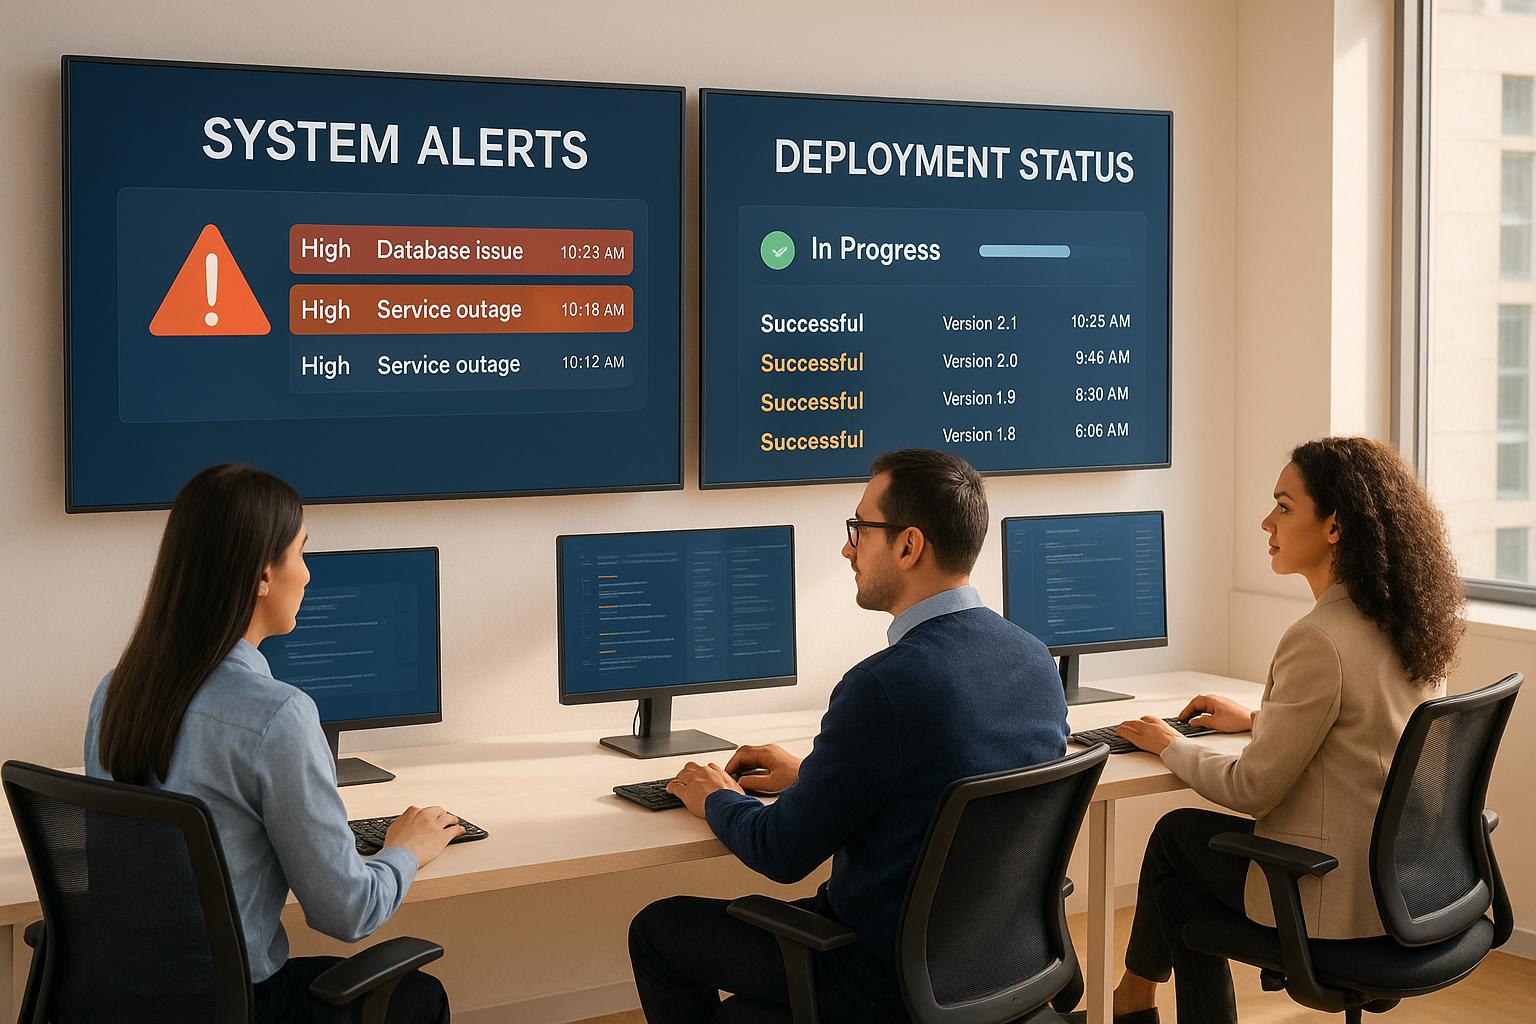
Real-Time Alert Architecture and Tools
Setting up effective real-time alerts requires deployment architectures that support continuous monitoring and phased rollouts. Let’s explore the available options and the tools that make them work.
Deployment Architecture Options
When it comes to deploying updates, choosing the right strategy can make all the difference. Here are three common approaches:
Blue-green deployments: This method uses two identical production environments. Traffic switches entirely from the old version (blue) to the new version (green) once testing confirms stability. While it allows for an instant rollback if issues arise, it does require double the infrastructure during deployment.
Canary deployments: With this approach, only a small portion of traffic is routed to the new version initially. Key metrics are closely monitored, and if problems occur, traffic automatically reverts to the stable version. This gradual rollout reduces the risk of widespread issues.
Rolling deployments: Updates happen one instance at a time, ensuring the service remains available throughout the process. Load balancers redirect traffic away from instances being updated, so users experience uninterrupted service.
The choice between these methods depends on factors like risk tolerance, infrastructure costs, and rollback needs. Once a deployment strategy is in place, the next step is integrating effective monitoring tools.
Monitoring and Alerting Tools
Real-time monitoring relies on tools designed to collect and analyse metrics as they happen. Here are some of the key players:
- Prometheus: Gathers time-series metrics from applications and infrastructure, making it a popular choice for monitoring.
- Grafana: Works alongside Prometheus to visualise data and set up automated alerts.
- OpenTelemetry: Provides a standardised way to collect metrics, logs, and traces, improving system-wide correlation.
- Istio and Linkerd: These service meshes focus on network-level metrics and enable traffic splitting, which is particularly useful for canary deployments.
The best tools are those that integrate seamlessly with your CI/CD pipeline and can scale to meet the demands of increasingly complex deployments.
Adding Deployment Data to Monitoring
To make monitoring even more effective, include deployment-specific data. Embed metadata like build SHA and deploy ID into logs, metrics, and traces to quickly identify which release might be causing performance changes [1].
Real-time monitoring systems work by collecting, transmitting, processing, and analysing data with minimal delay [2]. Data can be processed at the agent level for faster insights, while AI-driven tools help identify trends, anomalies, and patterns that need immediate attention [2].
Integrating multiple data sources enhances this process. For example, performance metrics from Prometheus or Datadog, analytics data, feature flag statuses from tools like LaunchDarkly, and incident reports from PagerDuty all contribute to smarter decision-making [1]. These inputs can help avoid deployments during high-traffic periods or ongoing incidents.
The move towards context-aware DevOps is changing the game. This approach focuses on embedding real-world signals into deployment workflows, shifting the mindset from “move fast and break things” to “move smart and protect things” [1]. As systems grow more distributed and the stakes of deployment failures increase, this shift becomes essential.
How to Implement Zero Downtime Deployments
Achieving zero downtime deployments involves careful planning, robust monitoring, and seamless integration of deployment pipelines. The goal is to ensure updates happen without disrupting your services, all while maintaining reliability.
Setting Up Monitoring
Start by implementing comprehensive monitoring that captures both system health and deployment-specific data. OpenTelemetry is a great tool for this, as it standardises how metrics, logs, and traces are collected across different platforms.
To get started, integrate OpenTelemetry SDKs into your applications and configure them to send data to your monitoring backend. A critical step here is embedding deployment metadata - such as build SHAs or deployment IDs - into your telemetry data. This makes it easier to link performance changes directly to specific releases.
When it comes to metrics, focus on the four golden signals
: latency, traffic, errors, and saturation. Use a tool like Prometheus to scrape metrics regularly, and add custom metrics relevant to your application, such as user sign-up rates or payment processing times.
Structured logging is another key aspect. Use JSON format for log entries and ensure consistent fields like service_name, version, request_id, and user_id. This structured approach makes it much easier to filter and analyse logs when issues arise during deployments.
Additionally, set up distributed tracing to follow requests across multiple services. This is especially useful for identifying how a deployment in one service might impact others. For high-traffic services, set sampling rates between 1% and 5% to balance observability with storage costs.
Once your monitoring is in place, the next step is to integrate real-time alerts into your CI/CD pipeline.
Adding Real-Time Alerts to CI/CD Pipelines
With monitoring established, automate alerting within your CI/CD process. Your pipeline should include checks at every stage - pre-deployment, progressive rollout, and post-deployment verification.
Before deployment, verify system health by monitoring key metrics. Roll out updates gradually, starting with a small percentage of traffic (e.g., 5%) and scaling up (25%, 50%, 100%) while continuously checking for anomalies. If error rates stay within acceptable limits and services function normally, proceed. Otherwise, halt the deployment immediately.
To safeguard against issues, implement automatic rollback triggers. For example, if error rates double or latency increases by more than 50%, traffic should automatically revert to the previous version. This requires your architecture to temporarily support both the old and new versions.
Post-deployment verification is equally important. Run synthetic tests against the new version to ensure core functionalities - like logging in, making purchases, or retrieving data - work as expected. These tests should run every minute during the first hour after deployment to catch any issues early.
Creating Alert Rules and Dashboards
Effective alerting ensures you catch real issues without being overwhelmed by false alarms. The key is setting thresholds based on historical data, not arbitrary numbers. Analyse error rates and latency trends from the past month to establish realistic benchmarks. For example, set alerts to trigger when error rates exceed three standard deviations from the mean or when latency spikes by more than 100% compared to the previous week.
During deployments, use specific alert rules that are more sensitive than usual. These could include:
- Error rates increasing by more than 25% compared to pre-deployment levels.
- New error types appearing that weren’t present in the previous version.
- Spikes in memory or CPU usage tied to the deployment.
- Database connection pool exhaustion or increased query timeouts.
Your dashboards should be designed to correlate performance metrics with deployment events. Overlay deployment markers on time-series graphs to help teams quickly identify whether performance changes are related to a recent update.
Each alert should include links to troubleshooting and rollback steps to speed up response times. For example, provide commands for checking deployment status, viewing logs, or initiating an emergency rollback.
Finally, configure alert routing based on severity and time. Critical deployment alerts should go directly to the on-call engineer via SMS or Slack, while less urgent alerts can be sent via email during working hours. Set up escalation policies to ensure unacknowledged alerts are addressed within 15 minutes by additional team members.
Need help optimizing your cloud costs?
Get expert advice on how to reduce your cloud expenses without sacrificing performance.
Testing Without Affecting Users
Testing deployment strategies in a way that doesn’t disrupt users requires careful planning. By validating changes under realistic conditions, you can ensure a smooth experience for users while making necessary updates.
Building on your monitoring set-up, these testing techniques help confirm that deployments run smoothly without interrupting live operations.
Shadow Traffic and Load Testing
Shadow traffic is a clever way to test updates by duplicating live traffic and sending it to your new deployment while users continue using the stable version. This approach allows you to see how the updated system handles real workloads without disrupting the live environment. By configuring your load balancer to mirror incoming requests to both versions, you can monitor key metrics like response times and error rates in real time.
Load testing works hand-in-hand with shadow traffic by simulating heavy usage scenarios. Tools such as Envoy Proxy, HAProxy, Artillery, and k6 can generate traffic patterns that mimic peak usage. This helps you identify potential bottlenecks or performance issues in critical user journeys before they affect actual users.
Game Days and Failure Testing
Game days are planned exercises where you intentionally introduce system failures to test your resilience. For example, you might simulate database connection errors or network latency spikes to evaluate how well your failover strategies work. These tests are best conducted during quieter periods, giving you the chance to monitor system behaviour and ensure alerts and rollbacks function as expected. Documenting the outcomes, including response times and rollback efficiency, helps refine your processes over time.
Synthetic Monitoring and UK Regional Testing
Synthetic monitoring uses automated tests to replicate user behaviour from specific locations. For businesses in the UK, you can deploy monitors in cities like London and Cardiff to simulate real user transactions. This proactive approach helps detect availability and performance issues before they impact your users.
Tools like Dynatrace and New Relic provide robust synthetic monitoring capabilities tailored to regional testing. By setting up tests for core user journeys across multiple UK locations, you can ensure your deployment performs consistently under different network conditions and regional demands.
These methods, combined with your real-time monitoring and alert systems, create a strong framework for maintaining system resilience throughout every stage of deployment.
Managing Monitoring Costs for UK Businesses
When it comes to maintaining strong monitoring and alert systems, keeping costs under control is just as critical as the setup itself. For UK businesses, unchecked monitoring expenses can quickly spiral, especially during high-volume deployments. The stakes are high - 44% of organisations report that outages cost them between £800,000 and over £4 million per hour [3].
Cutting Down Excess Alerts and Expenses
Too many alerts can overwhelm teams, delaying the resolution of incidents. A real-world example? BT Ireland used DX NetOps by Broadcom to slash alert volumes by 80% and cut mean resolution times by 40% [3].
Eliminate redundant alarms to boost operational efficiency.[3]
Striking the right balance between alert accuracy and cost control is essential. It means businesses can maintain zero downtime without overspending.
One effective approach is using alert suppression techniques. For instance, if a critical service goes offline, suppressing downstream alerts from related systems can help prevent teams from being flooded with unnecessary notifications. Policy-based condition correlation helps distinguish between minor glitches and major incidents, while service topology analysis maps service relationships and identifies root causes automatically. This not only speeds up investigations but also reduces duplicate efforts. Additionally, proactive capacity planning - using metric projections - enables teams to address potential issues before they escalate into alerts or affect users.
How Hokstad Consulting Can Help
Achieving zero downtime deployments demands expertise in DevOps, a solid cloud infrastructure, and a focus on cost efficiency. Hokstad Consulting provides tailored solutions to ensure every stage of deployment is reliable and budget-friendly.
DevOps Transformation and CI/CD Setup
Hokstad Consulting excels in transforming DevOps processes by building automated CI/CD pipelines that include integrated monitoring and alerting from the outset. This ensures potential issues are identified early and resolved before they affect users.
By embedding monitoring into the CI/CD pipeline, they implement health checks, performance tracking, and alert rule validation. This approach ensures that every deployment is closely monitored, allowing for swift responses to any problems.
They also design custom automation to enhance deployment pipelines. Whether it’s blue-green deployments or canary releases, Hokstad Consulting develops solutions with automated rollback policies triggered by real-time alerts. These tools ensure deployments are smooth and interruptions are minimised.
Cloud Cost Reduction and Savings
Optimising cloud costs is another critical area where Hokstad Consulting makes a difference. By employing strategies that reduce cloud expenses by 30–50%, they help UK businesses manage tight budgets while maintaining high-performance alerting systems.
Their approach focuses on smart metric collection and storage. By identifying key deployment metrics that predict potential failures, they reduce data ingestion costs and improve alert accuracy. This ensures businesses only pay for the data they truly need.
Strategic cloud migration is another cost-saving tool. By moving monitoring workloads to more economical cloud regions or services, companies can lower monthly expenses without sacrificing performance. Hokstad ensures that alerts remain timely and reliable, even with these cost-saving adjustments.
Custom Development and Automation
Standard monitoring tools often fall short when it comes to deployment-specific alerting needs. Hokstad Consulting steps in with bespoke solutions tailored to complex deployment scenarios.
For example, their deployment-aware alerting systems can differentiate between planned activities and actual incidents. During a canary deployment, the system automatically adjusts alert thresholds and suppresses non-critical notifications, preventing unnecessary distractions for operations teams.
To maintain production performance, advanced caching is used to manage monitoring during high-load periods. Custom automation intelligently samples metrics when activity spikes, while still providing full visibility during deployments. This ensures that monitoring systems don’t become a bottleneck during critical times.
Hokstad Consulting operates on a No Savings, No Fee
model, charging fees based on the savings achieved. They also offer on-demand DevOps support, helping businesses adapt as their deployment needs evolve. This includes optimising alerting systems, conducting security audits, and refining alert rules based on deployment data. Their solutions ensure that deployments remain seamless and cost-effective.
Conclusion: Reliable and Cost-Effective Deployments
Zero downtime deployments with real-time alerts are a game-changer for UK businesses, allowing them to keep services running smoothly even during updates. Instead of viewing downtime as an unavoidable part of progress, companies can now deliver new features and improvements without disrupting their users.
By incorporating integrated health checks, performance monitoring, and automated rollback systems, potential issues can be addressed before they affect users. With these tools in place, deployments shift from being high-stress events to routine tasks. This not only safeguards the user experience but also simplifies deployment management.
For businesses conscious of costs, smart monitoring is a practical solution. It reduces the need for manual interventions and minimises outages, often leading to lower operational costs over time. Investing in these systems can actually save money by preventing expensive disruptions.
Teams that adopt continuous monitoring and automated alerts often notice better collaboration between development and operations. Real-time visibility speeds up decision-making and ensures smoother processes. Additionally, regional testing ensures consistent performance across the UK, regardless of location or network differences.
The benefits of zero downtime deployments go beyond avoiding outages. Companies with dependable deployment processes can release updates more frequently, adapt quickly to market changes, and maintain a competitive edge. When deployment becomes a seamless process, teams can focus more on building innovative products rather than worrying about deployment risks.
This transformation often requires expert guidance. Hokstad Consulting, for example, offers a No Savings, No Fee
model, aligning their fees with the actual value delivered. This approach makes advanced deployment practices accessible through tailored solutions.
FAQs
What are the differences between blue-green, canary, and rolling deployments, and how do I choose the best one for my business?
Blue-green deployments involve setting up two identical environments, allowing you to switch traffic instantly between them. This approach ensures no downtime and makes quick rollbacks possible, which is especially useful for critical systems.
Canary deployments, on the other hand, introduce updates gradually to a small group of users. This method lets you monitor and test changes before rolling them out to everyone. While it reduces risk, it does take more time to complete.
Rolling deployments update servers step by step, ensuring continuous availability while using fewer resources. This method is great for scenarios where gradual updates are preferred and resource efficiency is a priority.
When deciding on the right strategy, think about your business needs. Blue-green is perfect for minimal downtime and instant rollbacks, canary is suited for safely testing new features, and rolling offers a steady, resource-conscious update process. Consider your infrastructure, how much risk you’re willing to take, and how quickly you need changes deployed to make the best choice.
How can I manage costs while maintaining real-time alerts for zero downtime deployments?
To keep costs under control while ensuring real-time alerts for zero downtime deployments, it's essential to choose cost-effective monitoring tools that align with your infrastructure. These tools allow you to monitor resource usage closely and spot inefficiencies, so you're only paying for what you actually need.
It's also a good idea to implement alert management best practices. Focus on prioritising critical alerts and automating routine tasks. This helps cut down on unnecessary distractions, enabling your team to concentrate on resolving urgent issues, which in turn reduces downtime and operational costs.
By fine-tuning your monitoring systems and simplifying alert processes, you can ensure smooth deployments without stretching your budget on unnecessary resources or tools.
How can I prevent real-time alerts from overwhelming my team with unnecessary notifications during deployments?
To cut down on unnecessary notifications during deployments, start by rigorously testing your alert rules. Use historical data and simulate real-time scenarios to ensure that alerts are meaningful and relevant. Adjust thresholds and conditions carefully to match your deployment process, steering clear of overly sensitive settings that could lead to false alarms.
You might also want to explore AI-powered tools to help analyse and filter alerts more efficiently. These tools can reduce the noise and ensure that critical issues are brought to the forefront. Equally important is clear communication with your team - make sure everyone understands the purpose and importance of each alert, so they can focus on what matters most. These steps can help keep your alerting system focused and effective during deployments.